Fig. 3
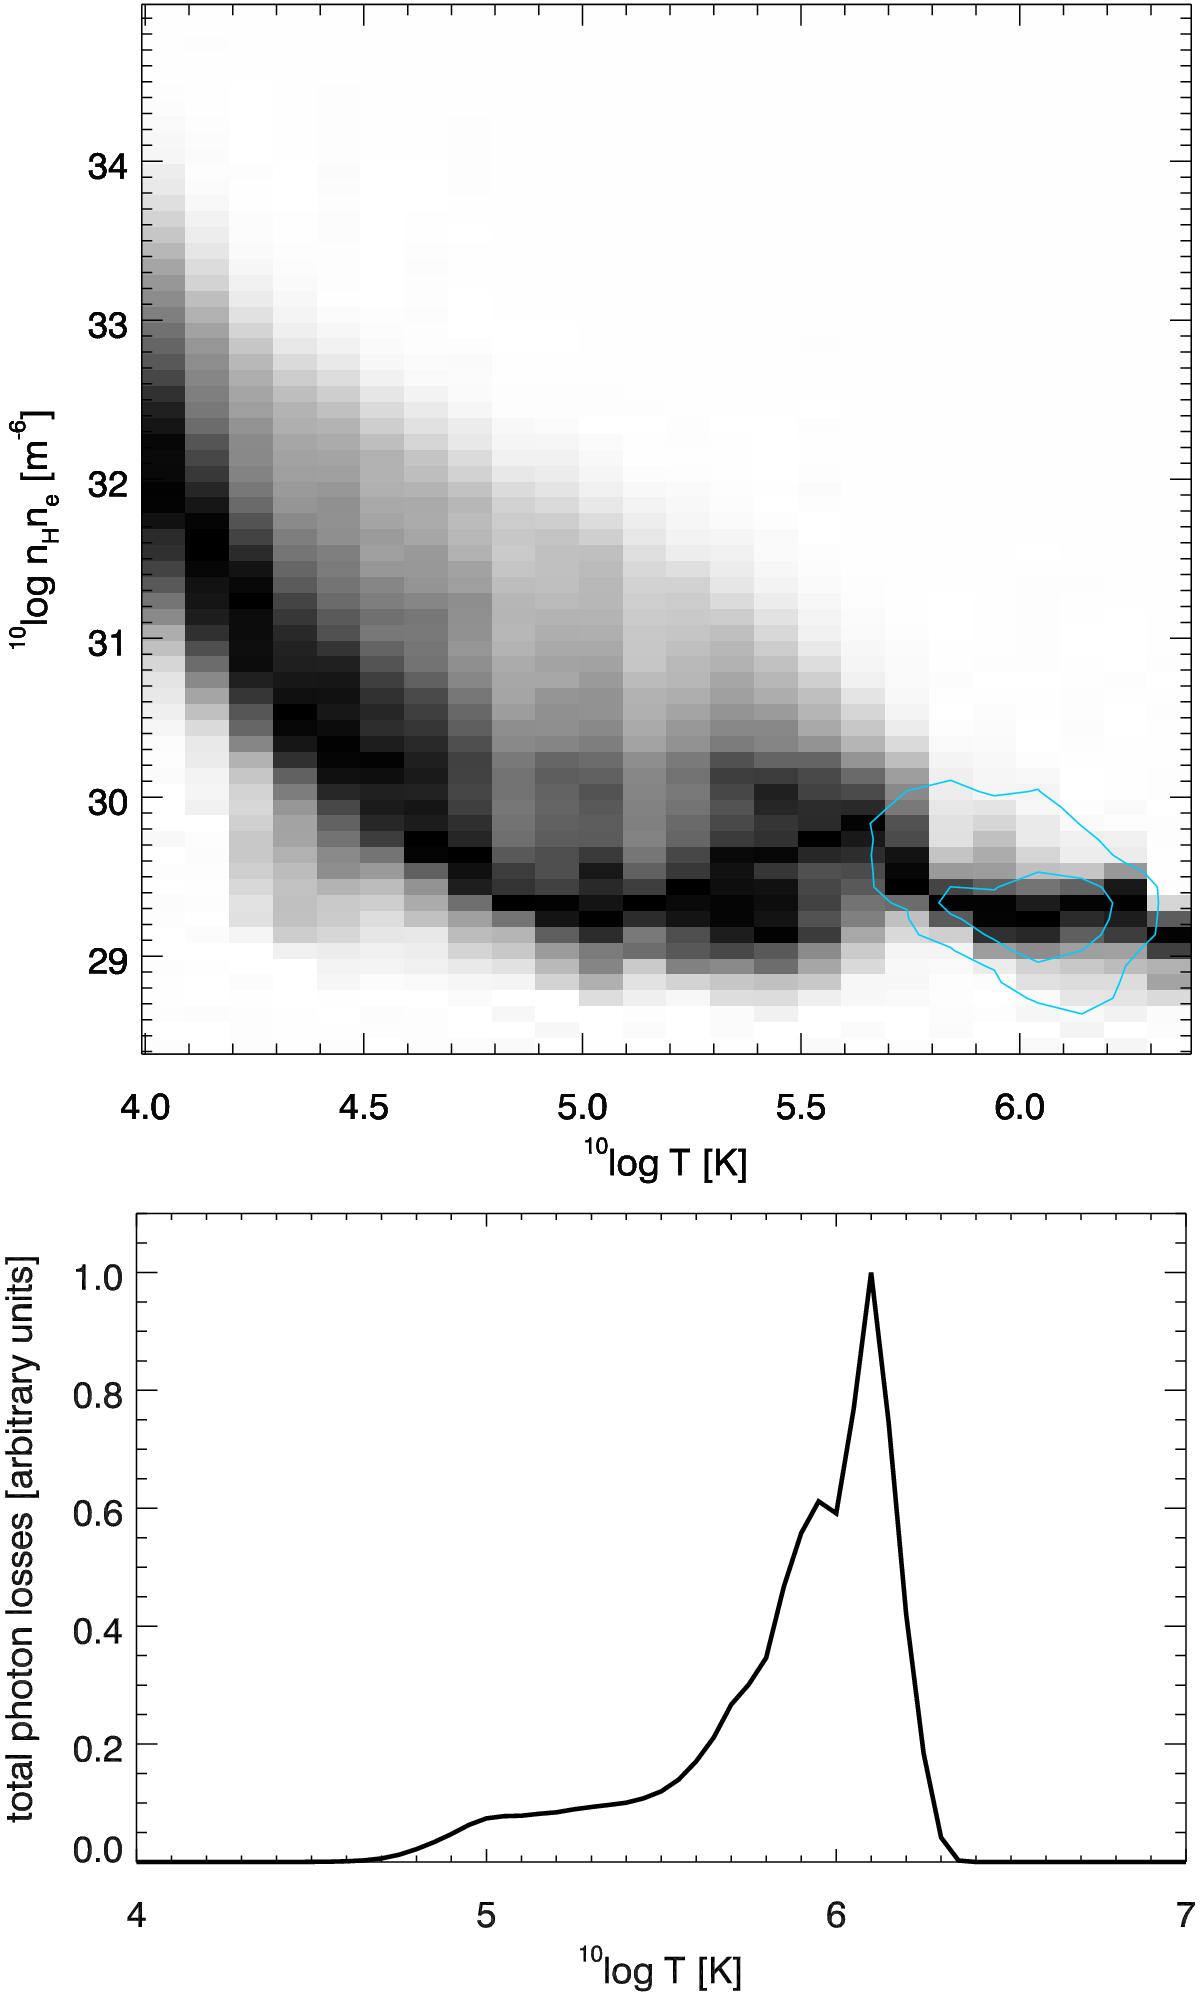
Top: scaled joint probability density functions (JPDF) of nHne versus T in the chromosphere and corona of our simulation snapshot. The inner blue contour includes 50% of all pixels, the outer contour 75%. Each column in the panels is scaled to maximum contrast to increase visibility. Bottom: volume-integrated, frequency integrated and cross-section weighthed photon losses as function of temperature in our simulation snapshot (i.e., ∫VLcsw dV in Eq. (5)).
Current usage metrics show cumulative count of Article Views (full-text article views including HTML views, PDF and ePub downloads, according to the available data) and Abstracts Views on Vision4Press platform.
Data correspond to usage on the plateform after 2015. The current usage metrics is available 48-96 hours after online publication and is updated daily on week days.
Initial download of the metrics may take a while.