Fig. 11
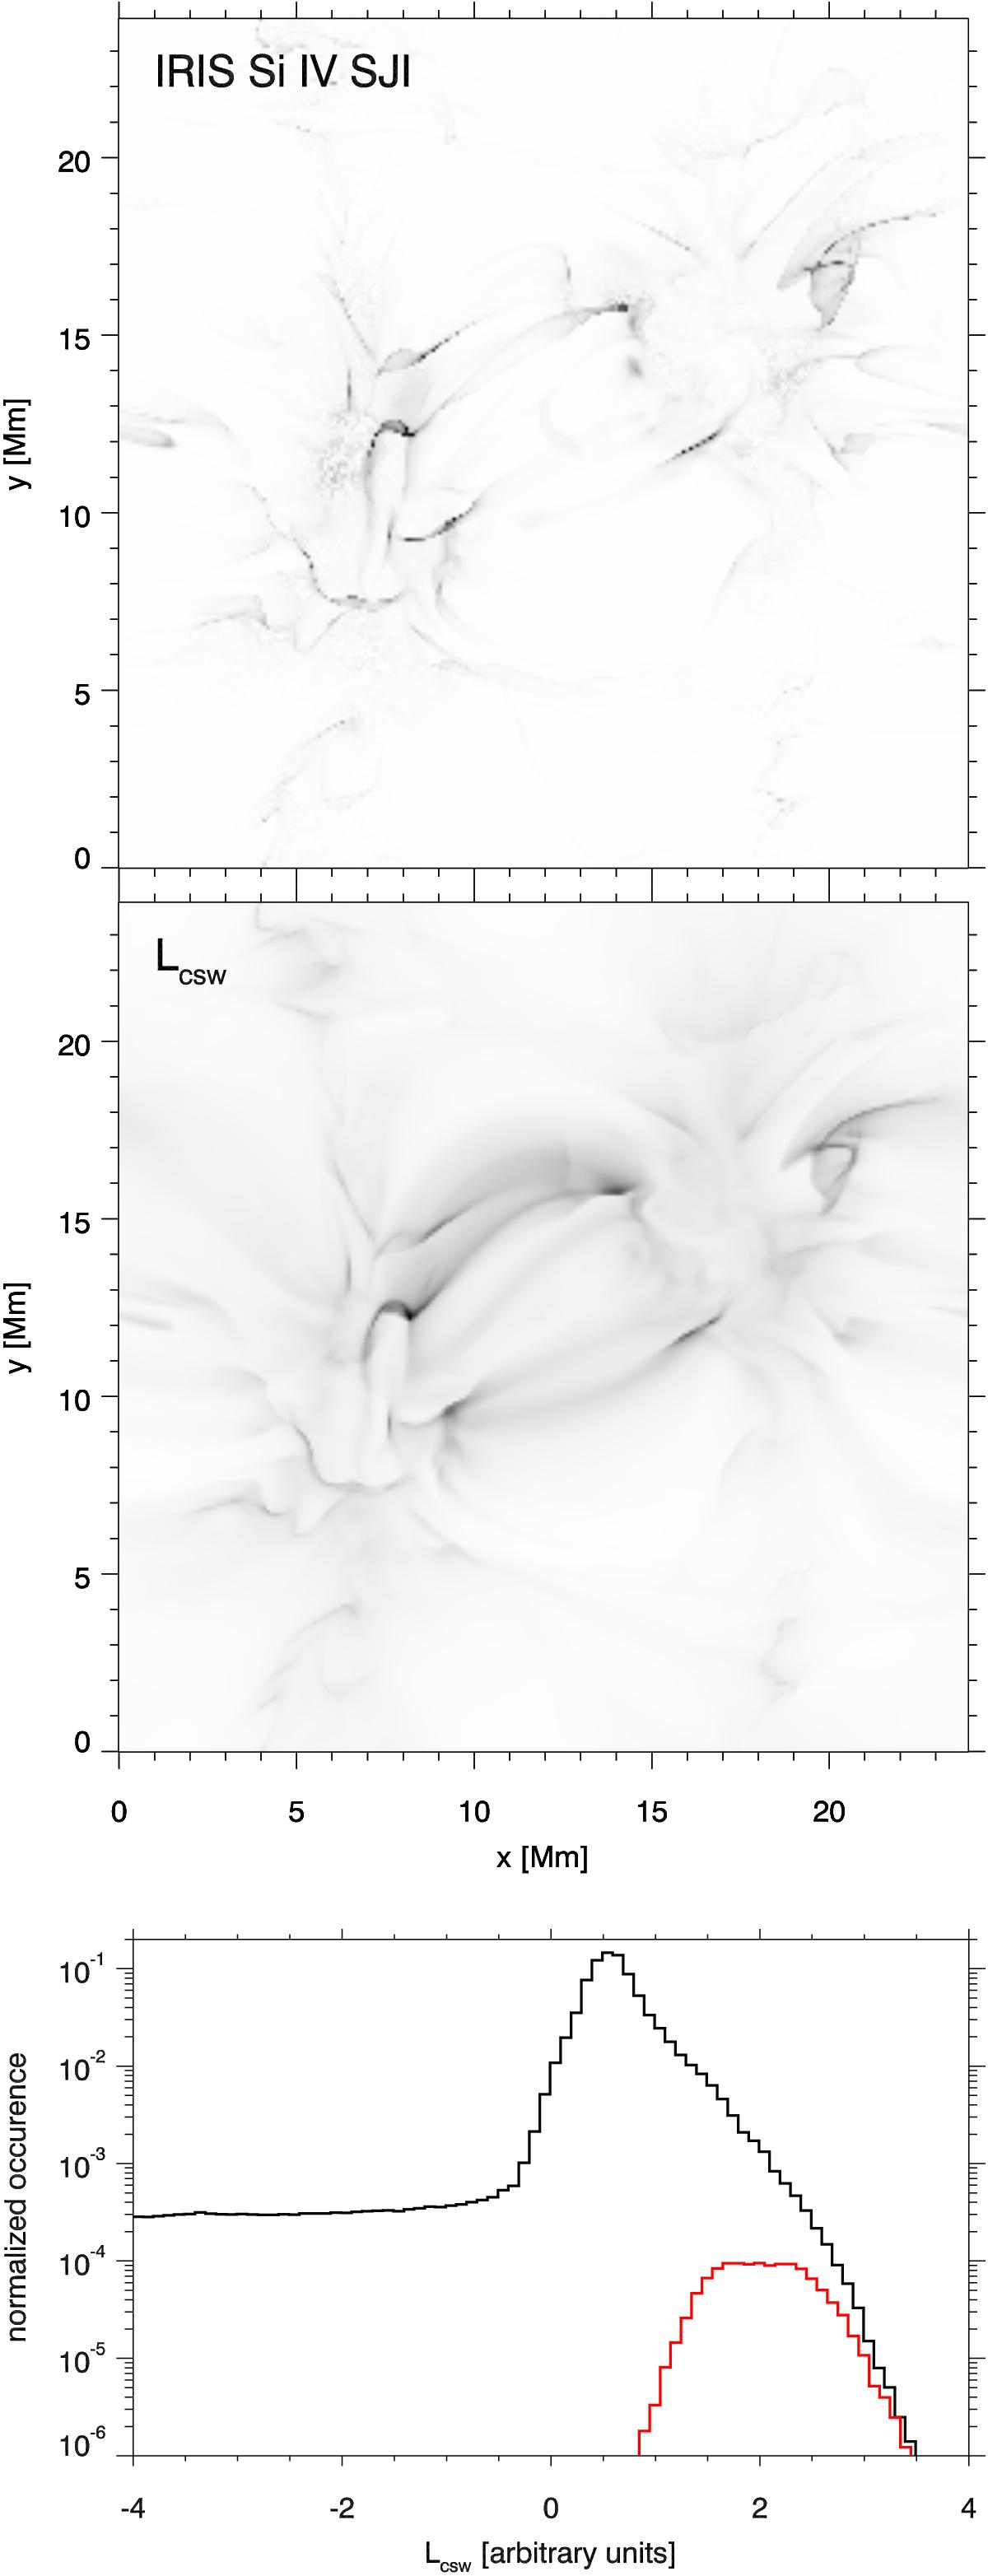
Comparison of the synthetic IRIS 140 nm slit jaw emission (upper panel) and an image computed from Lcsw, the frequency integrated and cross-section weighted photon losses (middle panel). The bottom panel shows the histogram of Lcsw for all grid points in the simulation (black) and only for the 0.1% of the grid points that have the highest Si iv emissivity (red).
Current usage metrics show cumulative count of Article Views (full-text article views including HTML views, PDF and ePub downloads, according to the available data) and Abstracts Views on Vision4Press platform.
Data correspond to usage on the plateform after 2015. The current usage metrics is available 48-96 hours after online publication and is updated daily on week days.
Initial download of the metrics may take a while.