Free Access
Fig. 3
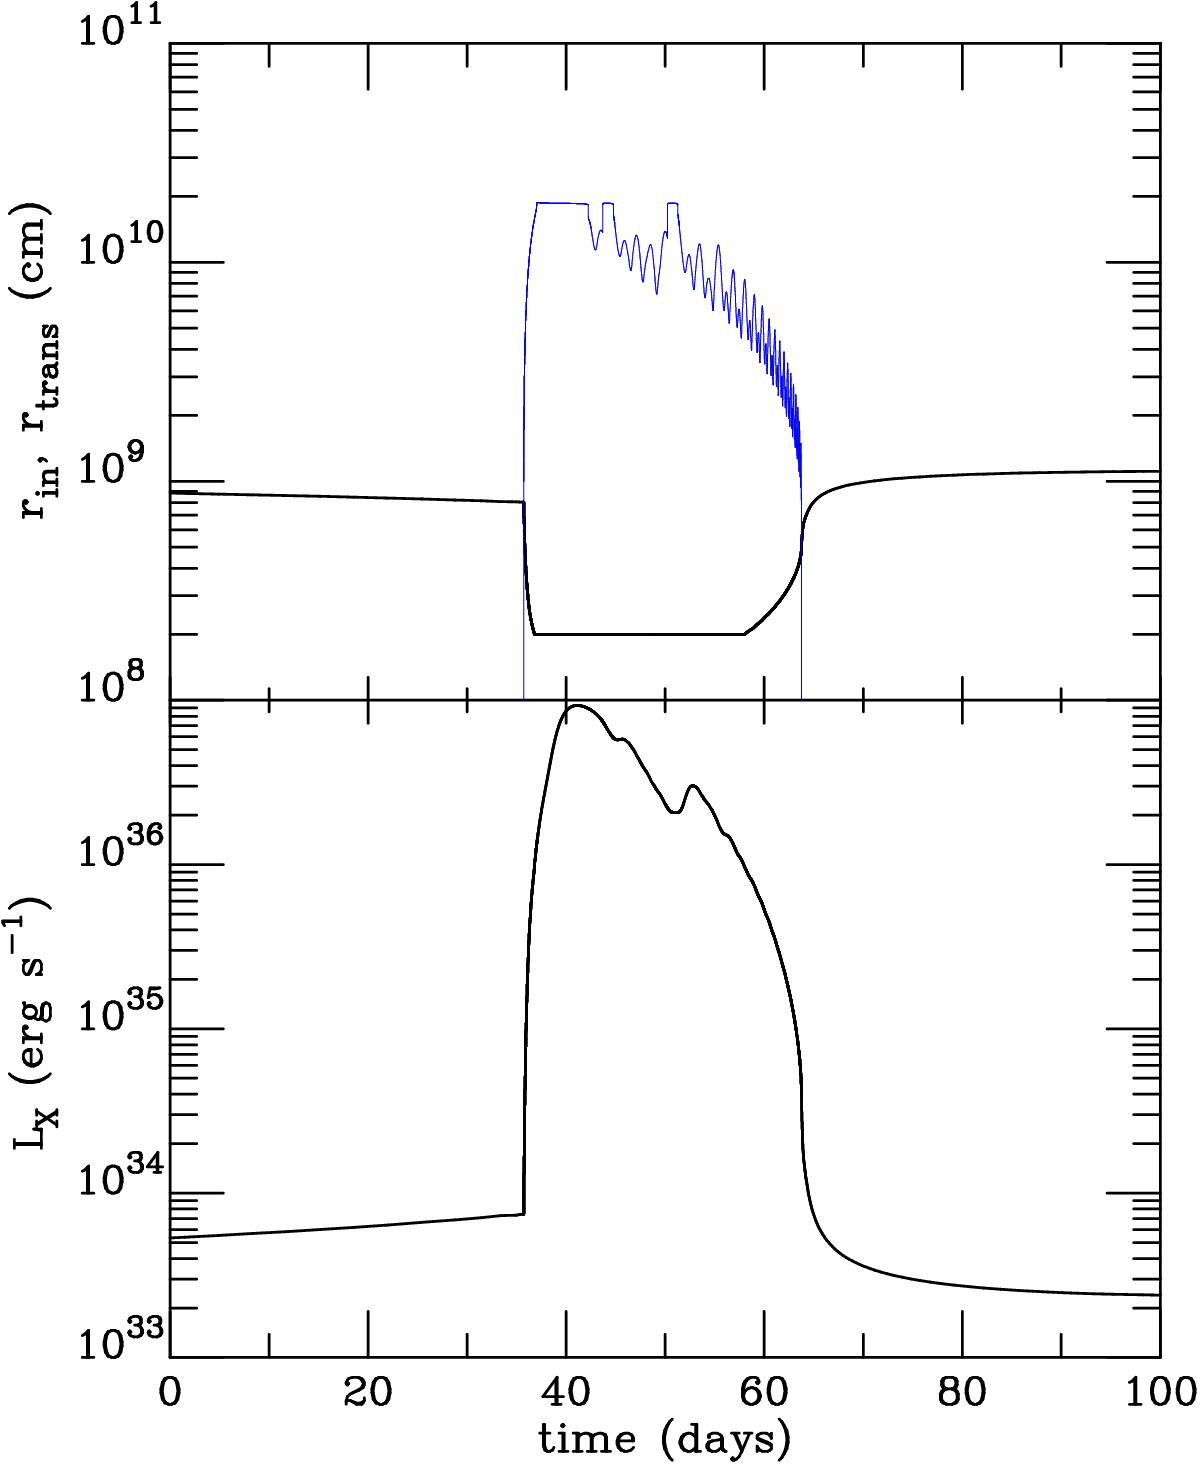
Detailed outburst profile for system shown in the upper panel of Fig. 2, with truncation of the inner disc at a variable radius. The X-ray luminosity is shown in the lower panel, and the upper panel shows the inner disc radius (solid black curve) and the position of the transition front (thin solid blue line).
Current usage metrics show cumulative count of Article Views (full-text article views including HTML views, PDF and ePub downloads, according to the available data) and Abstracts Views on Vision4Press platform.
Data correspond to usage on the plateform after 2015. The current usage metrics is available 48-96 hours after online publication and is updated daily on week days.
Initial download of the metrics may take a while.