Fig. 1
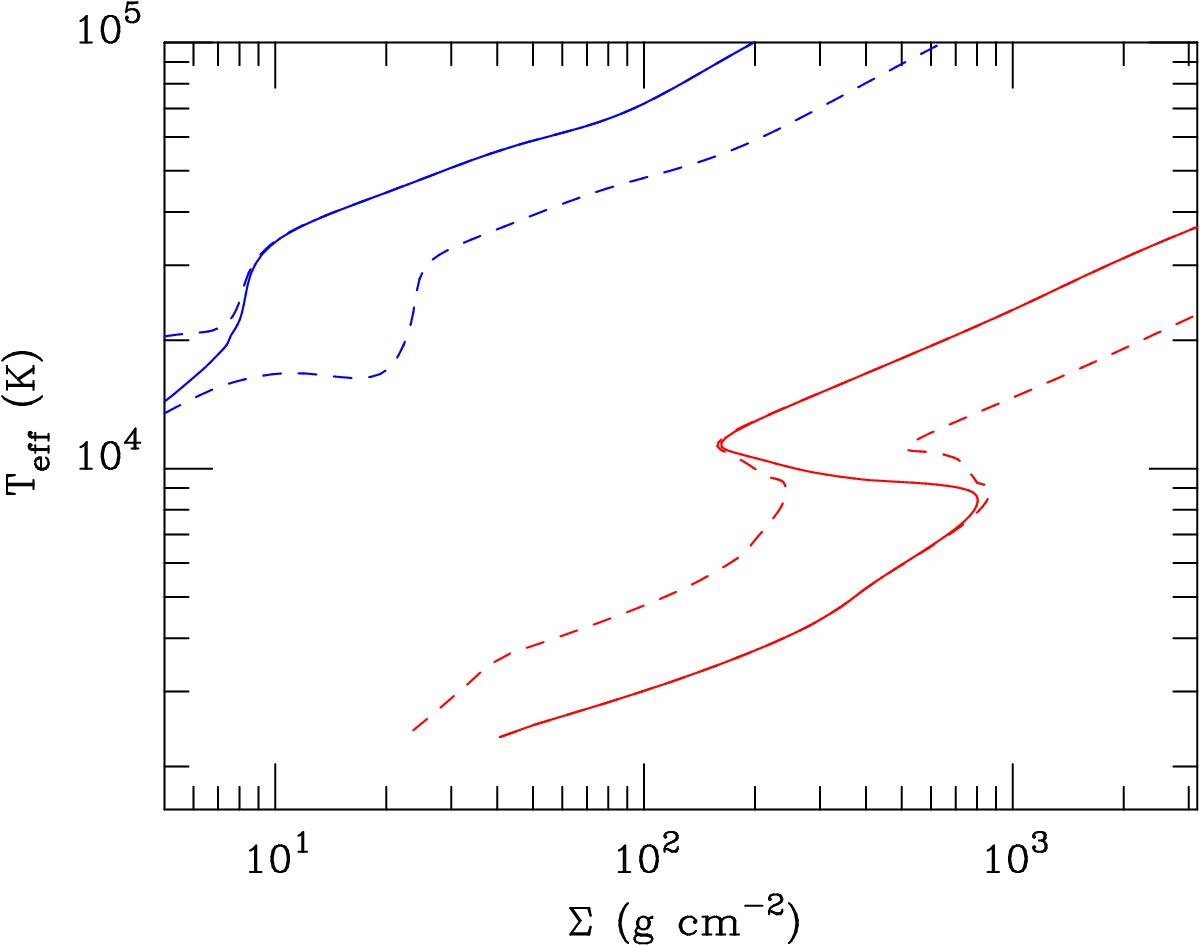
Two examples of local S curves – effective temperature vs. surface density – in a He disc when irradiation is included. The upper blue set of curves shows the case Tirr = 25 000 K and r = 5 × 108 cm, the lower red set of curves corresponds to Tirr = 5000 K and r = 1010 cm. In both cases, the solid curve corresponds to α given by Eq. (4), while the dotted curves are for α = 0.05 and α = 0.2 (rightmost and leftmost curves respectively). The primary mass is 1.4 M⊙.
Current usage metrics show cumulative count of Article Views (full-text article views including HTML views, PDF and ePub downloads, according to the available data) and Abstracts Views on Vision4Press platform.
Data correspond to usage on the plateform after 2015. The current usage metrics is available 48-96 hours after online publication and is updated daily on week days.
Initial download of the metrics may take a while.