Fig. 1
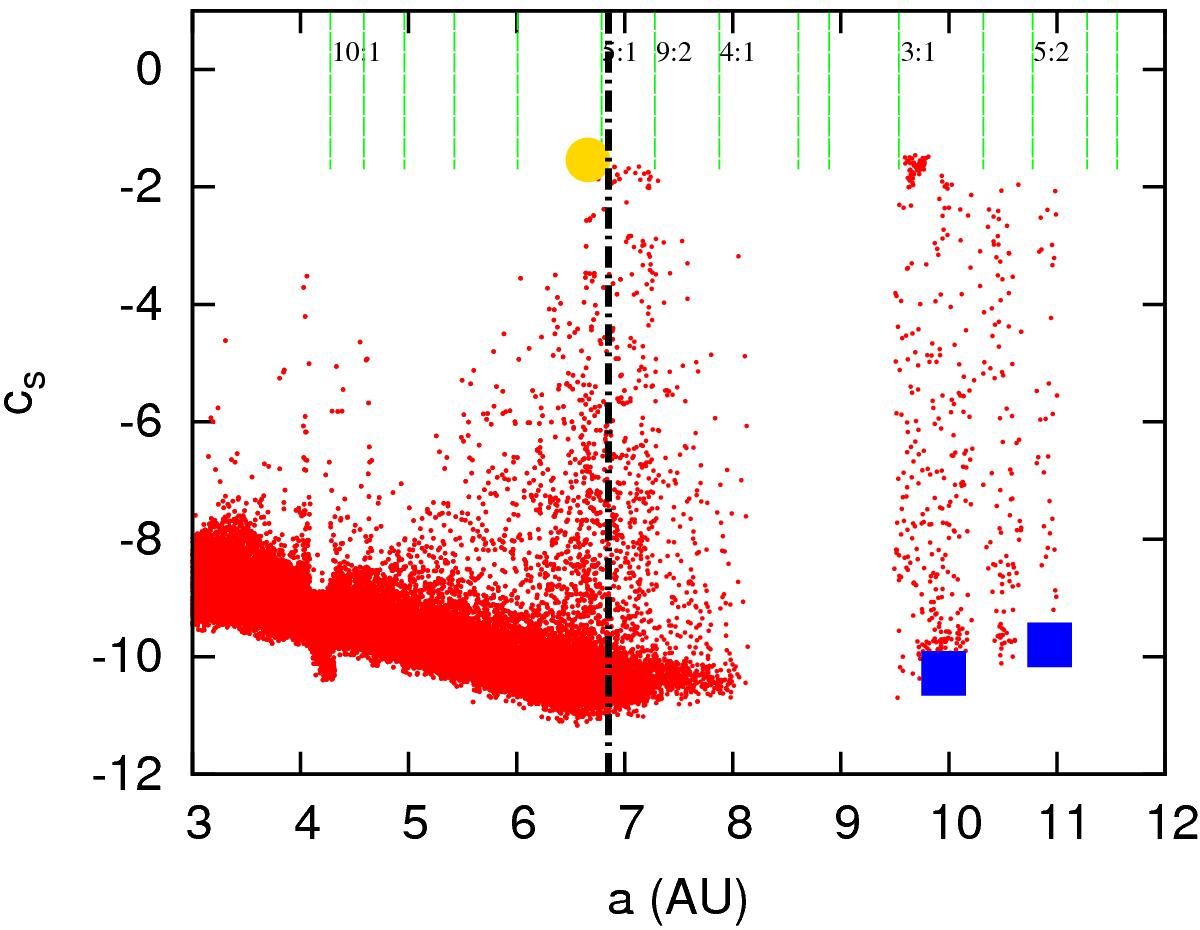
FMA analysis of a Jupiter-size single planet dynamics in a binary system with aB = 25 AU and eB = 0. The diffusion index cs is drawn vs. the semimajor axis of the planet. Small values of cs means low diffusion, while large values connote chaotic orbits. The yellow filled circle is a case with a large diffusion index which becomes unstable after about 60 Myr. The two filled blue squares are stable cases over 2 Gyr. The green dashed lines show the location of mean motion resonances between the planet and the companion star up to order 10. The black dash-dotted line marks the critical semimajor axis computed from the empirical formula of Holman & Wiegert (1999).
Current usage metrics show cumulative count of Article Views (full-text article views including HTML views, PDF and ePub downloads, according to the available data) and Abstracts Views on Vision4Press platform.
Data correspond to usage on the plateform after 2015. The current usage metrics is available 48-96 hours after online publication and is updated daily on week days.
Initial download of the metrics may take a while.