Free Access
Fig. 6
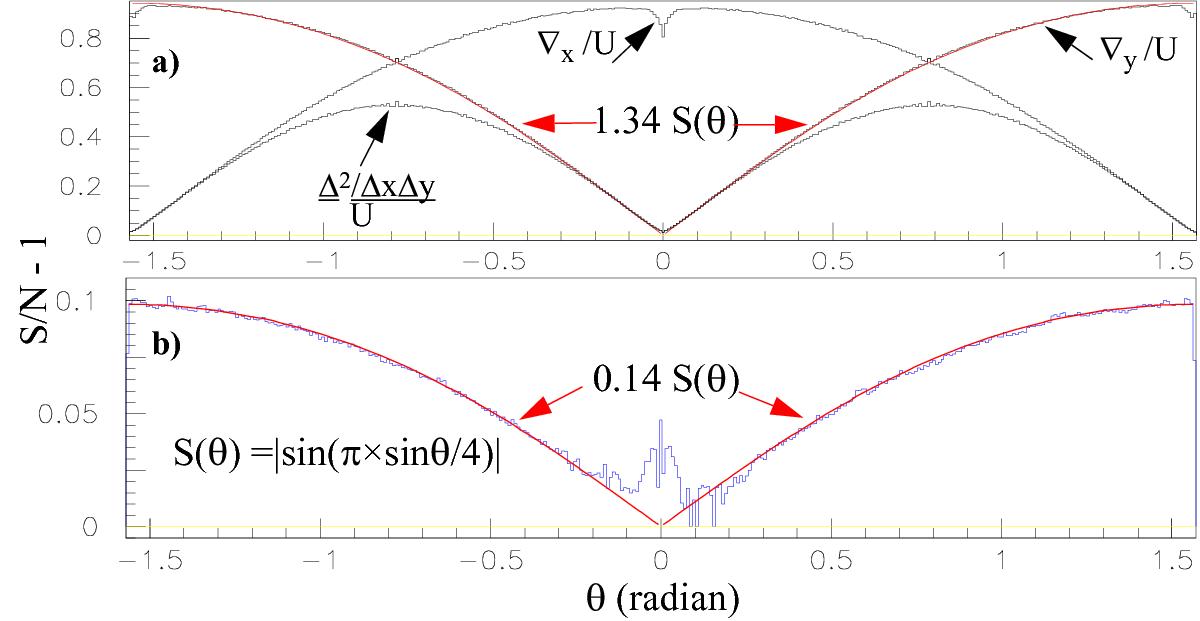
a) Spectral angular distribution of u+w after applying PDE operators, divided by the unity distribution U of Fig. 5. b) Spectral angular distribution of u–w, divided by U (inside the radial cut [ν1, ν2]). The uncorrelated random spectra, null after subtraction of unity, are plotted in yellow. Fitted curves are shown in red.
Current usage metrics show cumulative count of Article Views (full-text article views including HTML views, PDF and ePub downloads, according to the available data) and Abstracts Views on Vision4Press platform.
Data correspond to usage on the plateform after 2015. The current usage metrics is available 48-96 hours after online publication and is updated daily on week days.
Initial download of the metrics may take a while.