Fig. 19
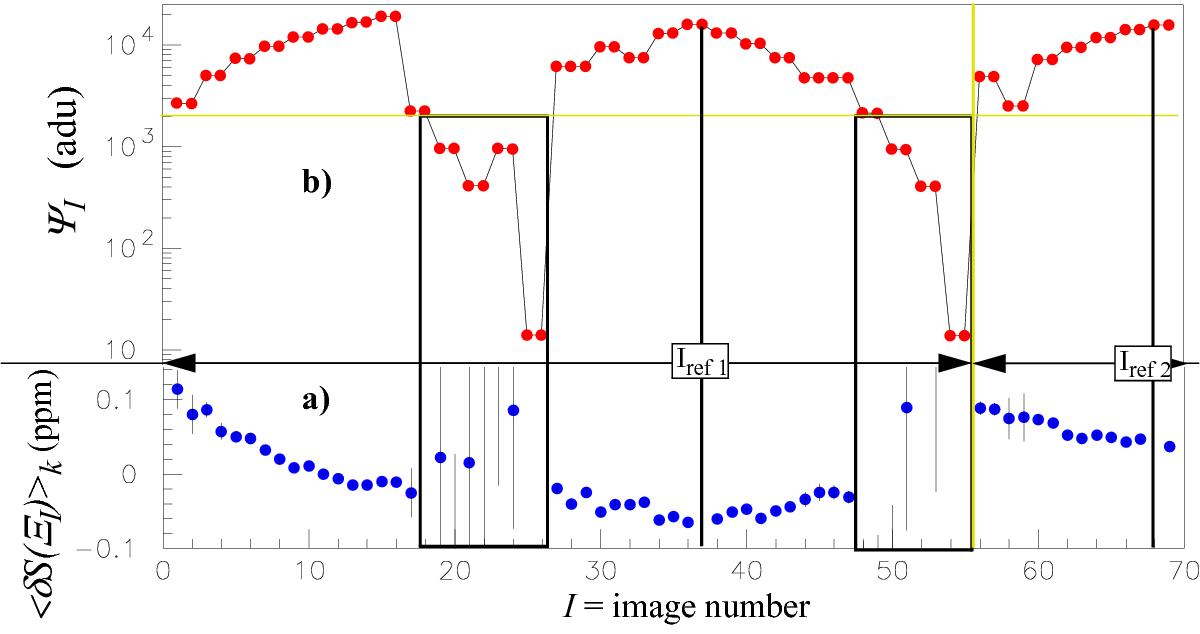
a) Bias ⟨ δSk(ΞI) ⟩ k (in blue) drift continuously with time. It equally affects all 72 residuals of the fit S(Ψ) vs. Ψ. When corrected, the width of the residual distribution is reduced to its photon statistics value (Fig. 20a). This correction is equivalent to a modification of the flux scale ΨI→ΦI. b) The flux ramp sequence ΨI (red), taken from Fig. 16, is correlated to the dispersion of biases (error bars in Fig. 19-a). For ΨI < 2000 adu (black boxes) the dispersion of the pedestals dominates the dispersion of the photon number.
Current usage metrics show cumulative count of Article Views (full-text article views including HTML views, PDF and ePub downloads, according to the available data) and Abstracts Views on Vision4Press platform.
Data correspond to usage on the plateform after 2015. The current usage metrics is available 48-96 hours after online publication and is updated daily on week days.
Initial download of the metrics may take a while.