Fig. 18
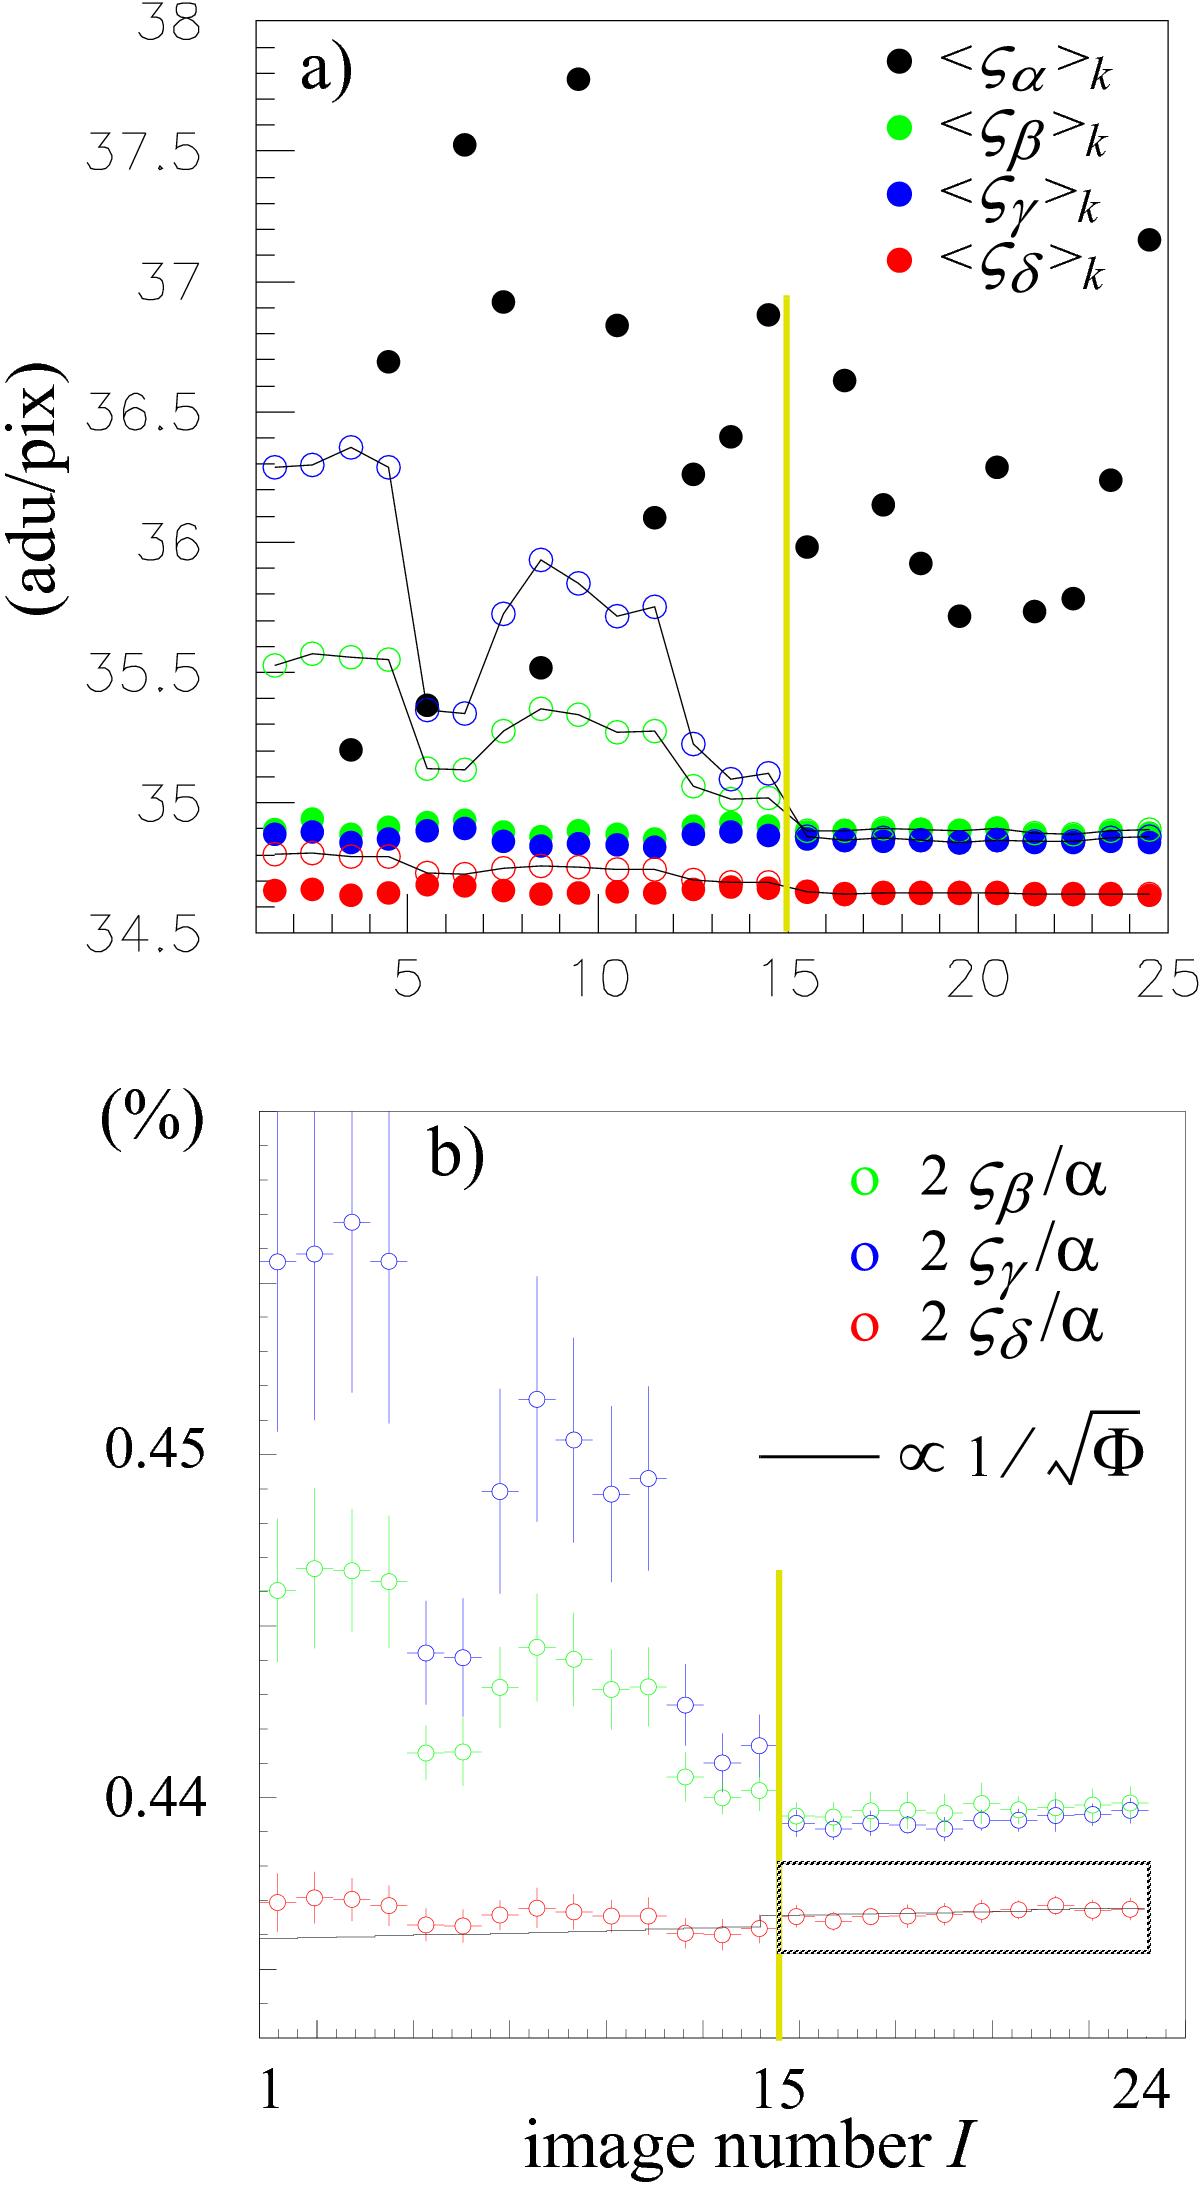
a) Fluctuations ςα,...,δ (rms) of α,...,δ between the last image I = 25 and any other one I = 1, 24 in temporal order (72 channels average). Open circles represent raw data and full circles data corrected for LED jitter. Variable α senses all noise sources; β (γ) suppresses the line (column) correlated electronic noise and the LED jitter along x (y) axes; δ suppresses all correlated noises and LED jitter. b) Relative fluctuations 2 ×⟨ ςβ(,γ,δ)/α ⟩ are compared to the prediction. The continuous line representing the prediction ∝1/![]() uses the flux Φ(t) drawn in Fig. 15b. Error bars are given by the Ψk dispersion (k = 1, 72). The individual channel precision is 5 × 10⁻⁶, the 72 channel average precision is 0.7 × 10⁻⁶.
uses the flux Φ(t) drawn in Fig. 15b. Error bars are given by the Ψk dispersion (k = 1, 72). The individual channel precision is 5 × 10⁻⁶, the 72 channel average precision is 0.7 × 10⁻⁶.
Current usage metrics show cumulative count of Article Views (full-text article views including HTML views, PDF and ePub downloads, according to the available data) and Abstracts Views on Vision4Press platform.
Data correspond to usage on the plateform after 2015. The current usage metrics is available 48-96 hours after online publication and is updated daily on week days.
Initial download of the metrics may take a while.