Fig. 16
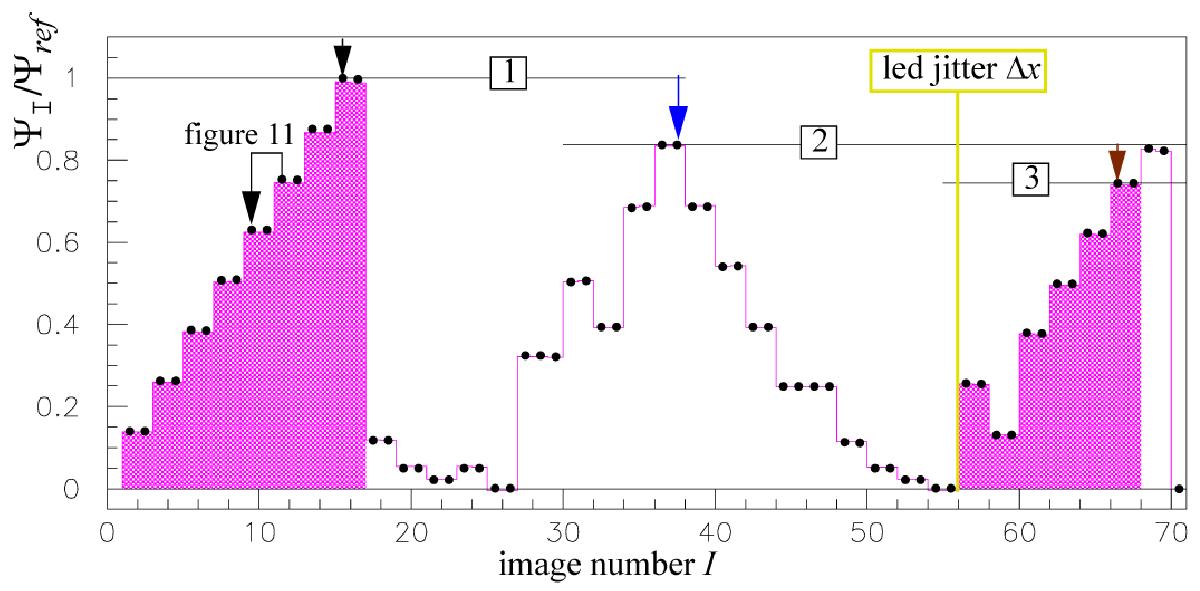
Setting up the relative fluxes within a sequence of 70 images: 1) three sequences, covered by horizontal lines, are built around three reference images (black, blue, and brown arrows). Gain × fluxes ratios are determined as in Fig. 11 (Icur = 9, Iref = 11). 2) The reference image of sequence 2 is measured relative to reference 1 and reference 3 relative to reference 2. By transitivity all fluxes are related. 3) The two overlap regions 1 over 2 and 2 over 3 yield a set of double determinations. The relative fluxes of all 70 images agree within 3 × 10⁻⁵ rms. They give the relations flux vs. exposure time (shaded area: 28 images at a common LED current) and flux vs. LED current (constant exposure time). The only significant LED jitter occurs between images 55 and 56.
Current usage metrics show cumulative count of Article Views (full-text article views including HTML views, PDF and ePub downloads, according to the available data) and Abstracts Views on Vision4Press platform.
Data correspond to usage on the plateform after 2015. The current usage metrics is available 48-96 hours after online publication and is updated daily on week days.
Initial download of the metrics may take a while.