Fig. 14
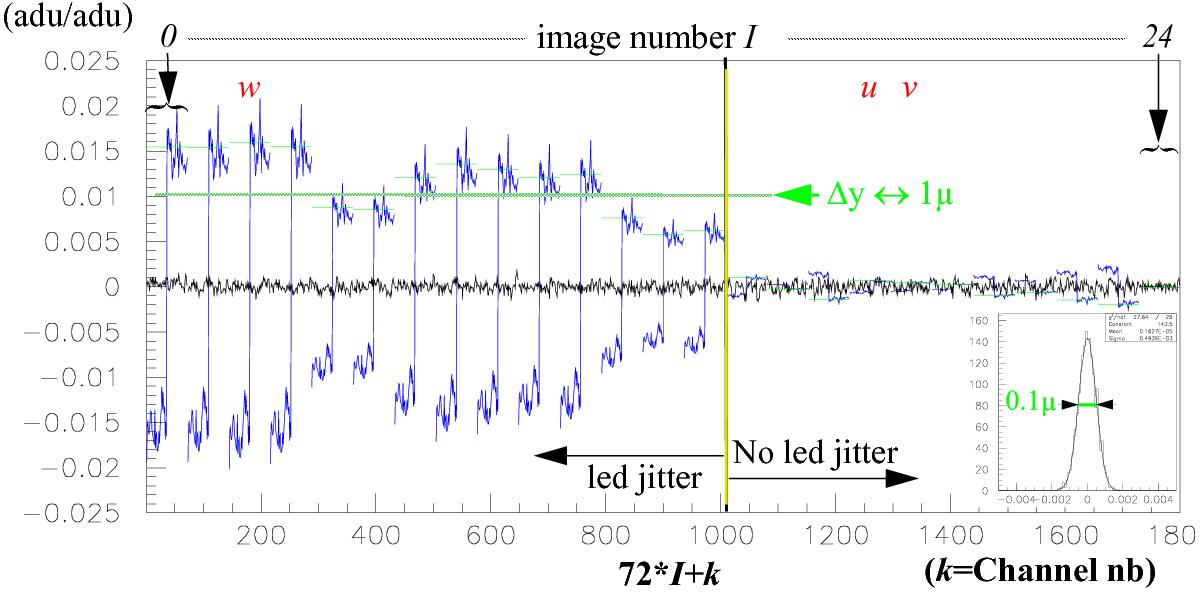
Signal of γ vs. α correlation as a function of channel k and image I (noted ηkΔyI, with ΔyI fixed to 0 for I = 24) (blue). Residual of the fit of this signal with one ηk parameter per channel and one ΔyI per image (black). Images I = 2, 17, 18 were called w, u, v in the spectral studies of Sect. 2. Δy is calibrated by comparison with Δyw → u. The inset shows a Gaussian fit of the residuals (1 point/channel/image) with a 5 × 10⁻⁴ rms, yielding Δyk = 0.05 μ or ⟨ Δyk ⟩ = 0.006 μ. The green line indicate the effect of a 1 μ LED drift.
Current usage metrics show cumulative count of Article Views (full-text article views including HTML views, PDF and ePub downloads, according to the available data) and Abstracts Views on Vision4Press platform.
Data correspond to usage on the plateform after 2015. The current usage metrics is available 48-96 hours after online publication and is updated daily on week days.
Initial download of the metrics may take a while.