Fig. 11
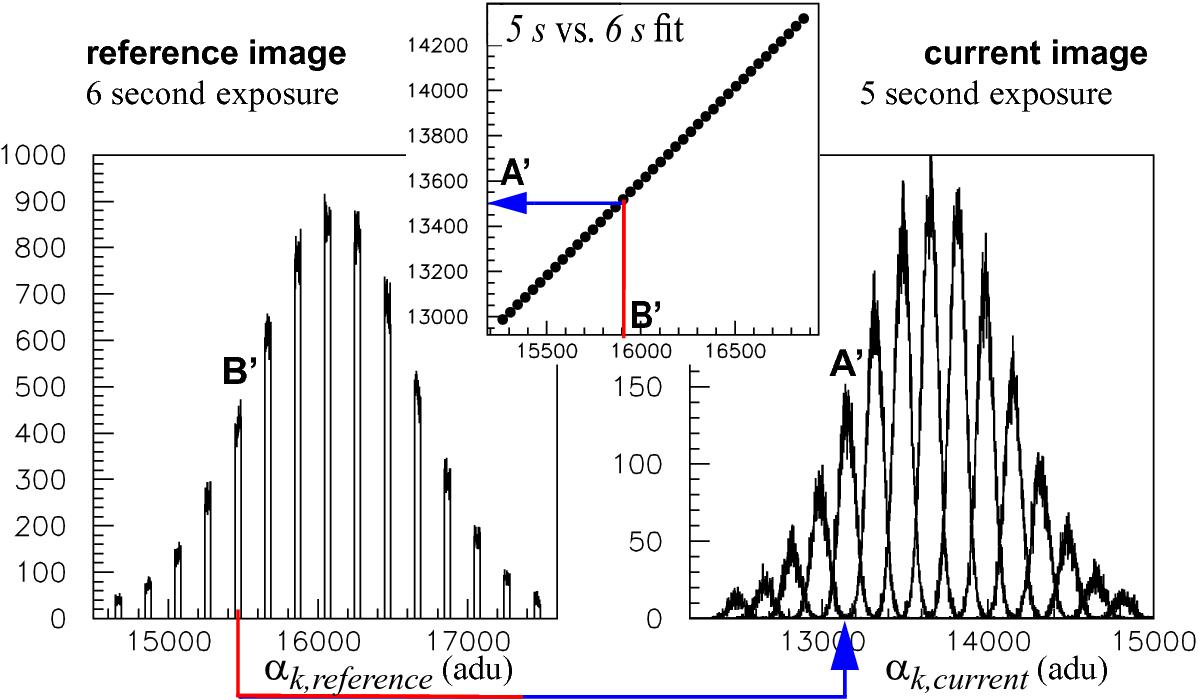
Left: histogram of α in the reference image subdivided in slices 40-adu wide. Right: histogram of the projection of each reference slice in any current image is a Gaussian. Only one slice for every five is represented. Top (inset): the means of the current slices are fit as a linear function of the means of the reference slices. The distribution of the residuals is shown in Fig. 12.
Current usage metrics show cumulative count of Article Views (full-text article views including HTML views, PDF and ePub downloads, according to the available data) and Abstracts Views on Vision4Press platform.
Data correspond to usage on the plateform after 2015. The current usage metrics is available 48-96 hours after online publication and is updated daily on week days.
Initial download of the metrics may take a while.