Fig. 6
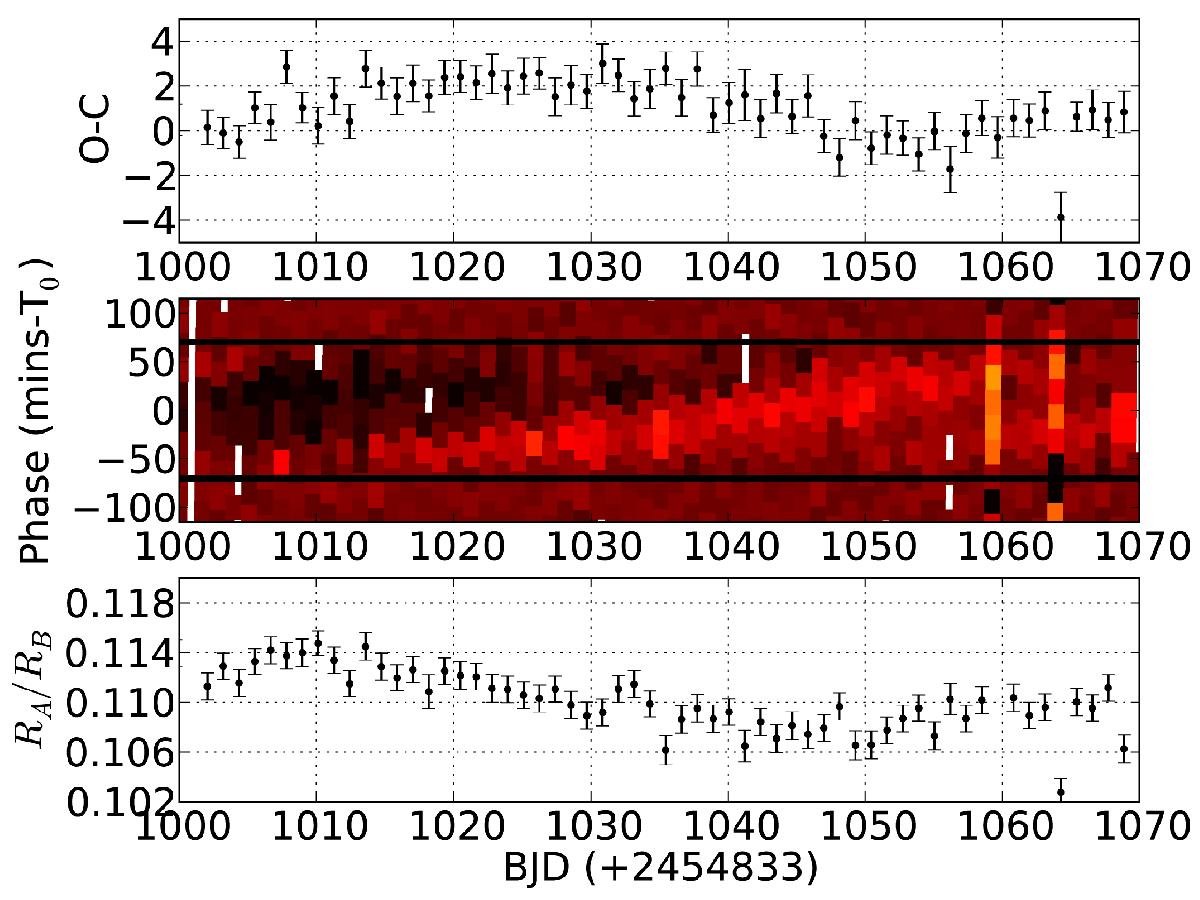
Top: part of O−C diagram of KOI-1452 between 1000 days ≤ BJD (+2 454 833) ≤ 1070 days. Middle: concurrent unsharp masking transit light curve residuals. The bright stripe is due to spot-crossing anomalies, which change their position from one transit to the next due to the small period difference (cf. Fig. 1). The white areas indicate no data. The black lines indicate the first and fourth contact of the eclipse. Bottom: variation of the measured radii RB/RA for each eclipse. During the strongest observed TTV the star appears to be larger because of spot coverage during the transit (Czesla et al. 2009).
Current usage metrics show cumulative count of Article Views (full-text article views including HTML views, PDF and ePub downloads, according to the available data) and Abstracts Views on Vision4Press platform.
Data correspond to usage on the plateform after 2015. The current usage metrics is available 48-96 hours after online publication and is updated daily on week days.
Initial download of the metrics may take a while.