Fig. 2
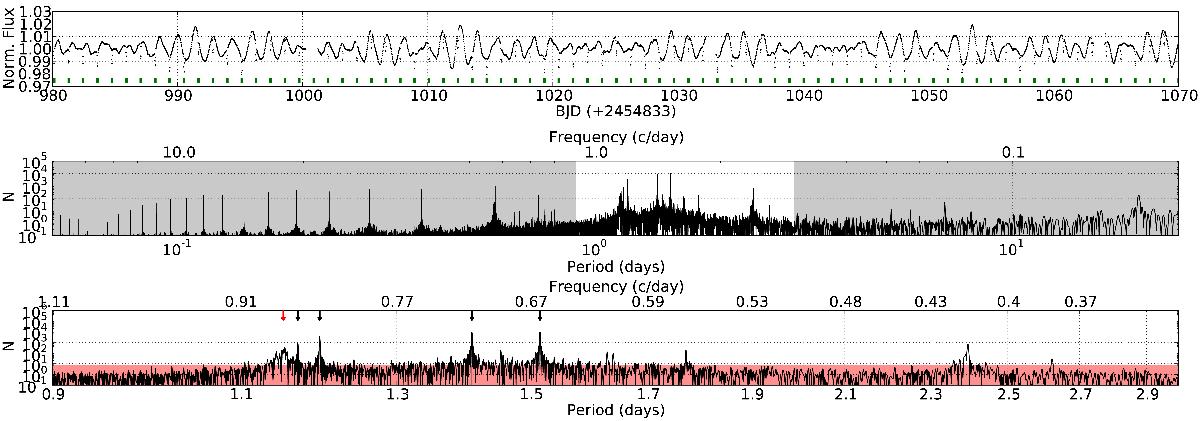
Top: part of KOI-1452 light curve. There are clear periodic variations, suggesting the appearance of spots in the visible stellar hemispheres (see text for details). The primary eclipses are indicated with green markers. Middle: the L-S periodogram of the total Kepler light curve. The unshaded part around the area with the most significant periodicities is shown enlarged in the lower panel. Bottom: the red shaded area shows the values of the periodogram with false alarm probability higher than 10-3. The four most prominent periods of the L-S periodogram with periods of P1 = 1.516 days, P2 = 1.4097 days, P3 = 1.1978 days and P4 = 1.1702 days are indicated by black arrows, while the red arrow indicates the orbital period of the system (Porb = 1.1522 days).
Current usage metrics show cumulative count of Article Views (full-text article views including HTML views, PDF and ePub downloads, according to the available data) and Abstracts Views on Vision4Press platform.
Data correspond to usage on the plateform after 2015. The current usage metrics is available 48-96 hours after online publication and is updated daily on week days.
Initial download of the metrics may take a while.