Fig. 1
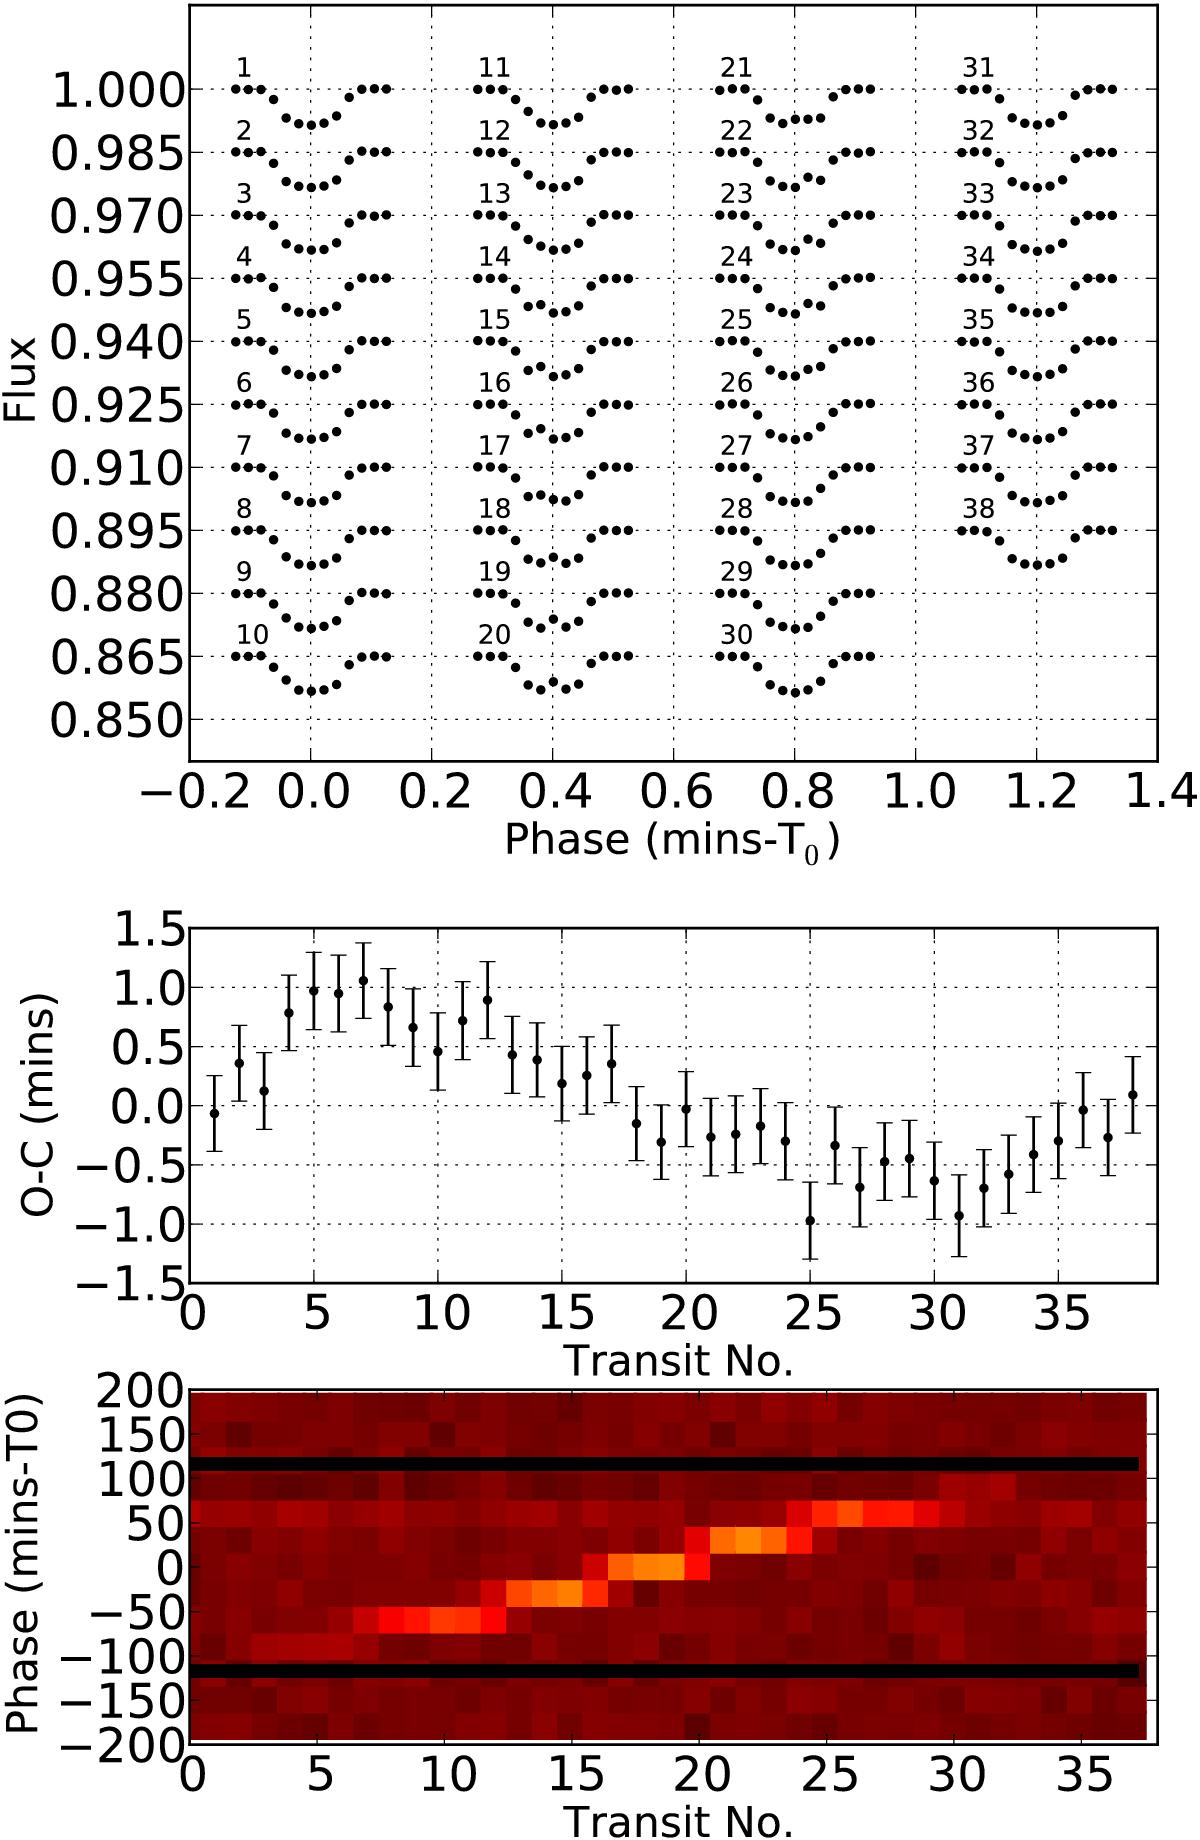
Top: consecutive simulated transits of a planet with an orbital period Porb = 1.0132P⋆. Each light curve is affected by spot-crossing events; see text for details. Middle: estimated mid-transit times of the transits in the top panel. The sinusoidal shape of the O−C diagram is the result of spot-crossing anomalies in the transits Ioannidis et al. (2016). Bottom: unsharp masking transit residuals of the planet; note the correlation with the sinusoidal O–C diagram in the middle panel.
Current usage metrics show cumulative count of Article Views (full-text article views including HTML views, PDF and ePub downloads, according to the available data) and Abstracts Views on Vision4Press platform.
Data correspond to usage on the plateform after 2015. The current usage metrics is available 48-96 hours after online publication and is updated daily on week days.
Initial download of the metrics may take a while.