Fig. 7
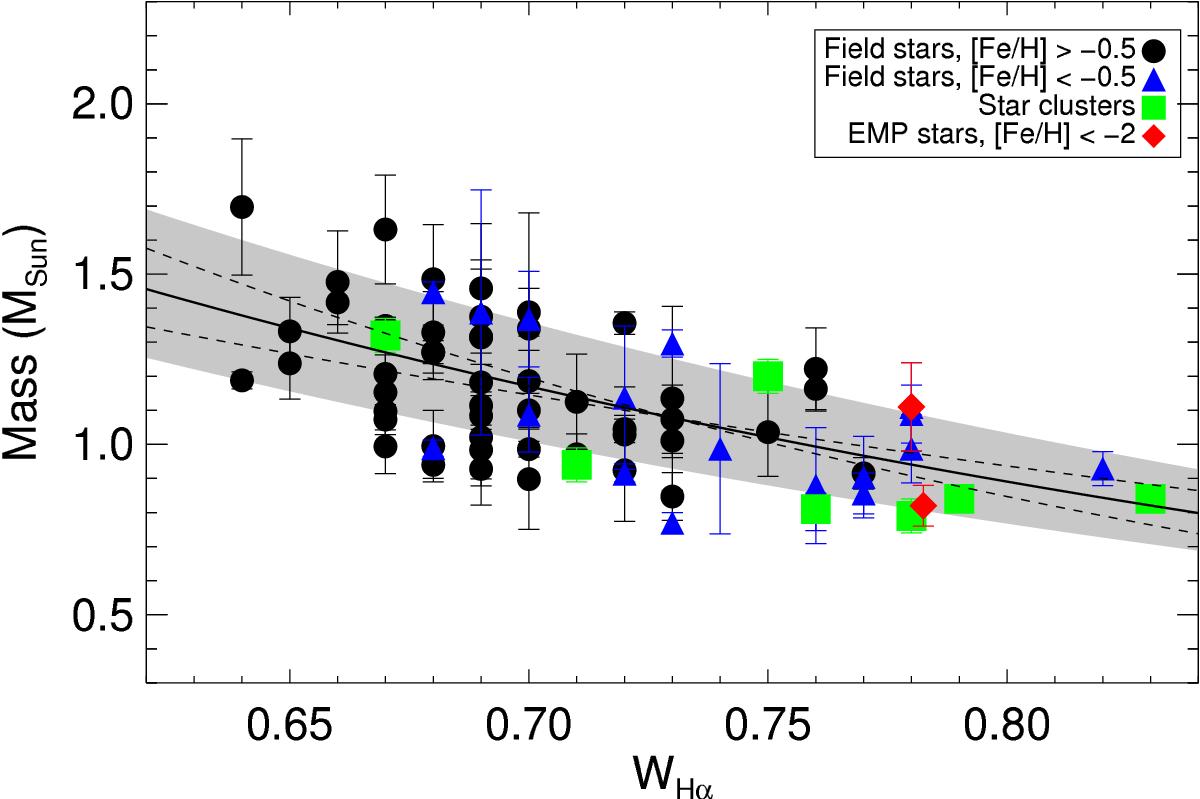
Observed relation between the Hα spectral line widths versus asteroseismic masses of stars. Star clusters from the Gaia-ESO survey are shown with green squares. The very metal-poor stars in the sample, [Fe/H] < − 2, are shown with red symbols. Dashed black lines show the 1σ uncertainty of the fit. The shaded area is the average rms between the data and the fit. See Sect. 3.
Current usage metrics show cumulative count of Article Views (full-text article views including HTML views, PDF and ePub downloads, according to the available data) and Abstracts Views on Vision4Press platform.
Data correspond to usage on the plateform after 2015. The current usage metrics is available 48-96 hours after online publication and is updated daily on week days.
Initial download of the metrics may take a while.