Free Access
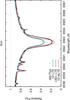
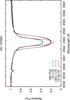
Fig. 2

Model line profiles (colour lines) computed with different physics (1D LTE, mean 3D LTE, 1D NLTE) in comparison with the observed spectrum of the Sun (dots, top) and the metal-poor red giant HD 122563 (dots, bottom). The models lie far away from the data, thus we resort to an empirical method (Sect. 2.5).
This figure is made of several images, please see below:
Current usage metrics show cumulative count of Article Views (full-text article views including HTML views, PDF and ePub downloads, according to the available data) and Abstracts Views on Vision4Press platform.
Data correspond to usage on the plateform after 2015. The current usage metrics is available 48-96 hours after online publication and is updated daily on week days.
Initial download of the metrics may take a while.