Fig. 1
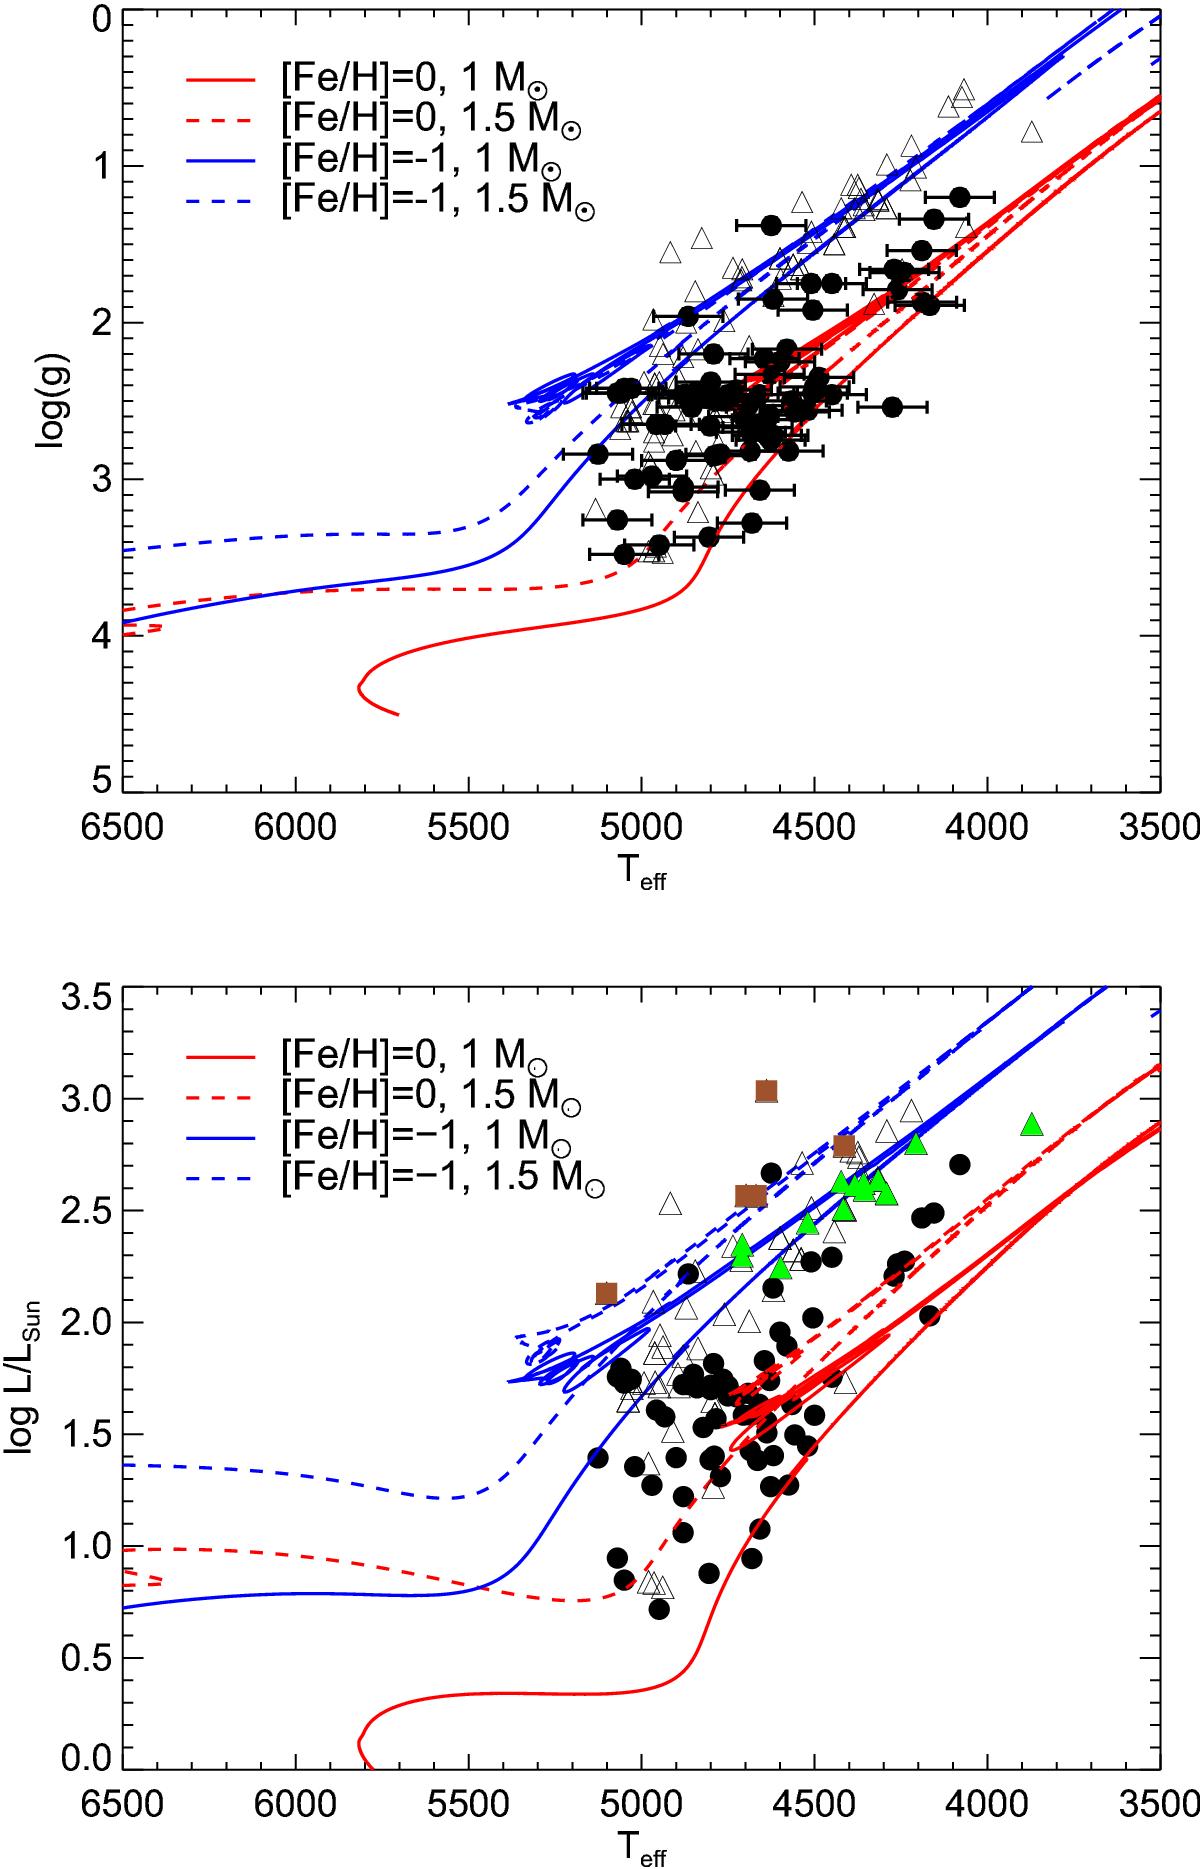
Hertzsprung-Russell diagram for the observed stellar sample: black filled points show the stars with asteroseismic masses, triangles depict the stars in stellar clusters. The stars in the globular clusters NGC 2808 and NGC 4372 are shown with green triangles and brown squares, respectively. The Garstec evolutionary tracks (Serenelli et al. 2013) for different masses and metallicities are also shown.
Current usage metrics show cumulative count of Article Views (full-text article views including HTML views, PDF and ePub downloads, according to the available data) and Abstracts Views on Vision4Press platform.
Data correspond to usage on the plateform after 2015. The current usage metrics is available 48-96 hours after online publication and is updated daily on week days.
Initial download of the metrics may take a while.