Fig. 9
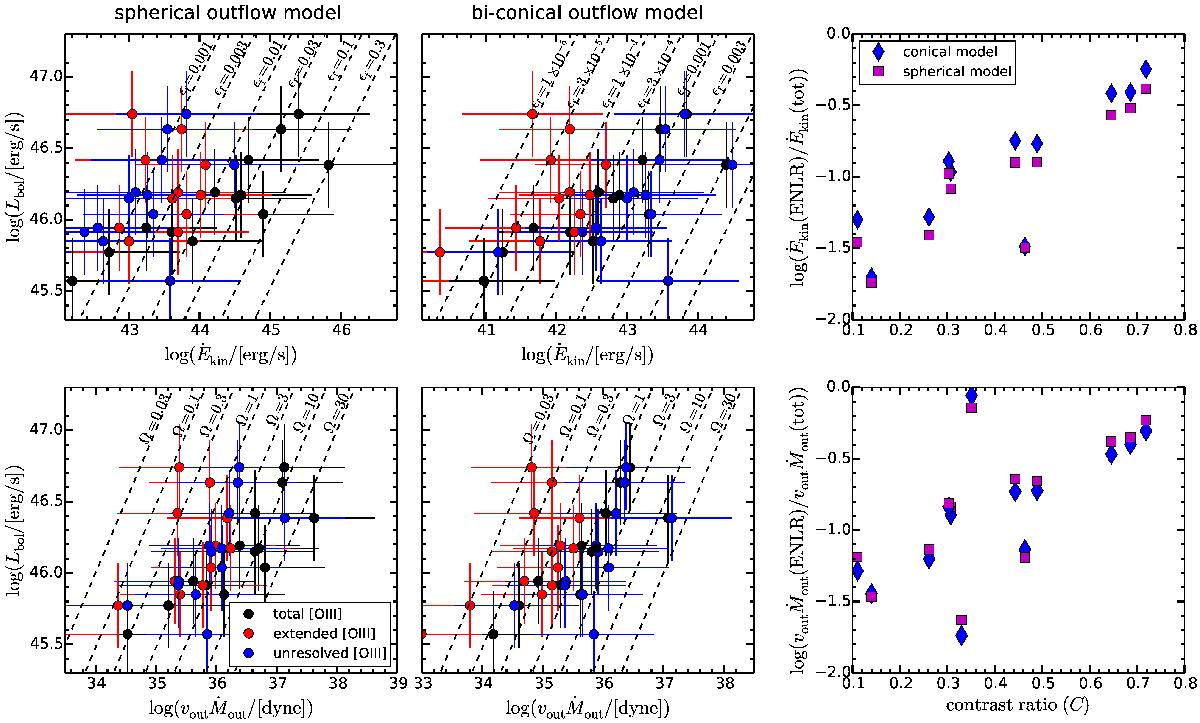
Bolometric AGN luminosity (Lbol) versus kinetic power (Ėkin) and momentum outflow rate (voutṀout) for the spherical and conical outflow model at kpc-scale distances (D = 5 kpc). The black and red data points correspond to the measurements from the total and extended [O iii] line profile maps, respectively. In addition we also plot the corresponding values from the spatially unresolved [O iii] line from the NLR as blue data points. This is based on the conical formula but also applies to the spherical case as described in the main text. The dashed lines correspond to various AGN feedback efficiencies (ϵf) and outflow covering factors (Ω) as labelled in the corresponding panels. The error bars on Ėkin correspond to the range in electron densities 10 <ne< 1000. The uncertainty on Lbol is assumed to be 0.3 dex taking into account the photometric calibration of the data and the error on the bolometric correction factor. In the right panels, we show the change of the kinetic power and the momentum outflow rate from the total and extended [O iii] measurements as a function of contrast ratio (C).
Current usage metrics show cumulative count of Article Views (full-text article views including HTML views, PDF and ePub downloads, according to the available data) and Abstracts Views on Vision4Press platform.
Data correspond to usage on the plateform after 2015. The current usage metrics is available 48-96 hours after online publication and is updated daily on week days.
Initial download of the metrics may take a while.