Fig. 8
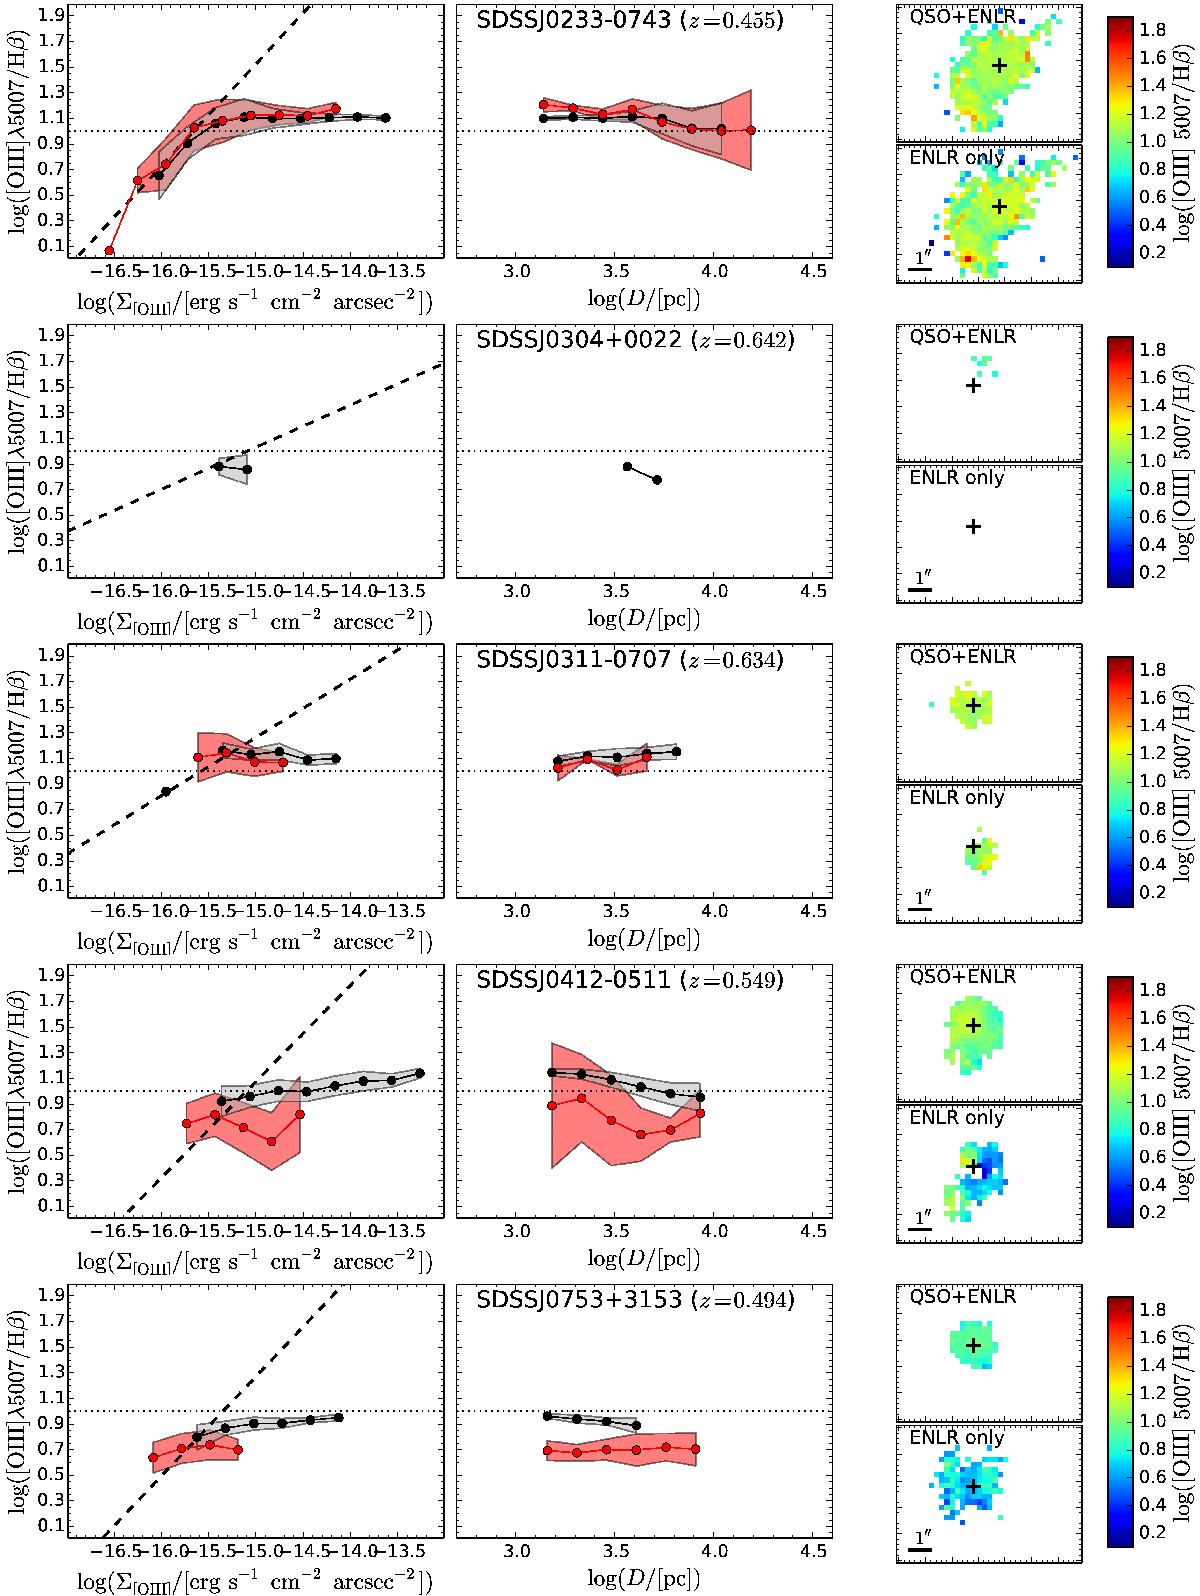
Example of the [O iii]/Hβ emission-line ratio distribution for SDSS J0233-0743. The line ratio is shown as a function of [O iii] surface brightness, distance from the QSO, and its 2D distribution before (black points) and after performing the QSO-host galaxy deblending (red points). Similar figures for all QSOs are moved to the Appendix.
Current usage metrics show cumulative count of Article Views (full-text article views including HTML views, PDF and ePub downloads, according to the available data) and Abstracts Views on Vision4Press platform.
Data correspond to usage on the plateform after 2015. The current usage metrics is available 48-96 hours after online publication and is updated daily on week days.
Initial download of the metrics may take a while.