Fig. 7
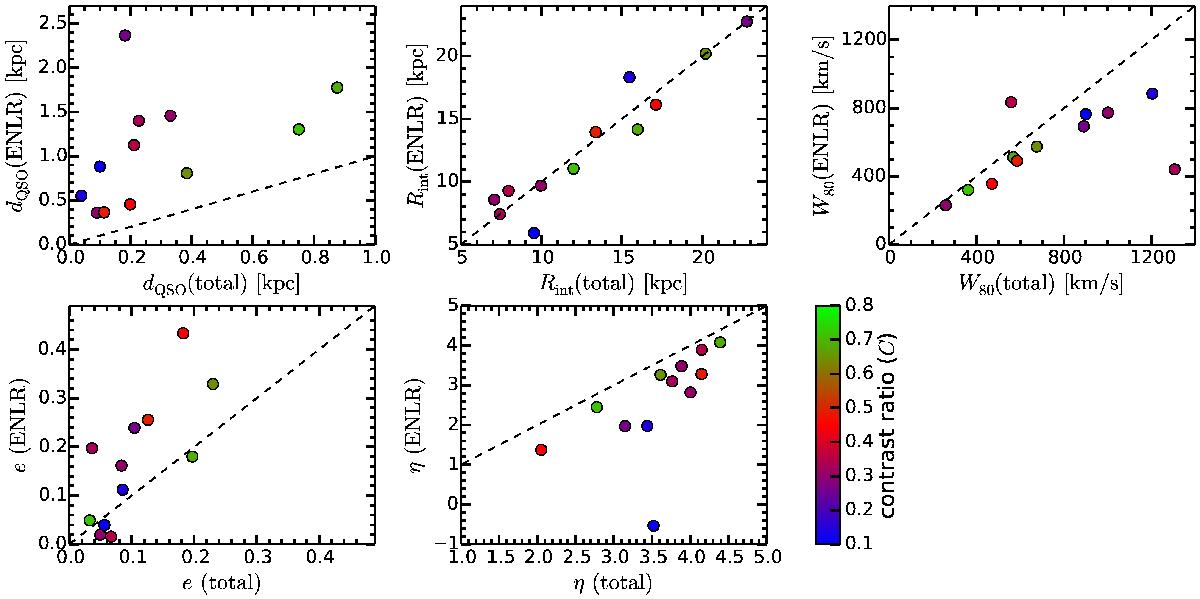
Comparison of the total and ENLR [O iii] line measurements for the centroid distance from the QSO (dQSO), maximum size out to a fixed surface brightness limit (Rint), the median [O iii] line width within the central 1′′ (W80), the ellipticity of the central [O iii] emitting region (e) and the outer power-law radial surface brightness slope (η). The 1:1 relations are shown as a dashed line in each panel. The colour of each data point corresponds to the contrast ratio C as indicated by the colour bar which is defined as the fraction of resolved to the total [O iii] emission.
Current usage metrics show cumulative count of Article Views (full-text article views including HTML views, PDF and ePub downloads, according to the available data) and Abstracts Views on Vision4Press platform.
Data correspond to usage on the plateform after 2015. The current usage metrics is available 48-96 hours after online publication and is updated daily on week days.
Initial download of the metrics may take a while.