Fig. 6
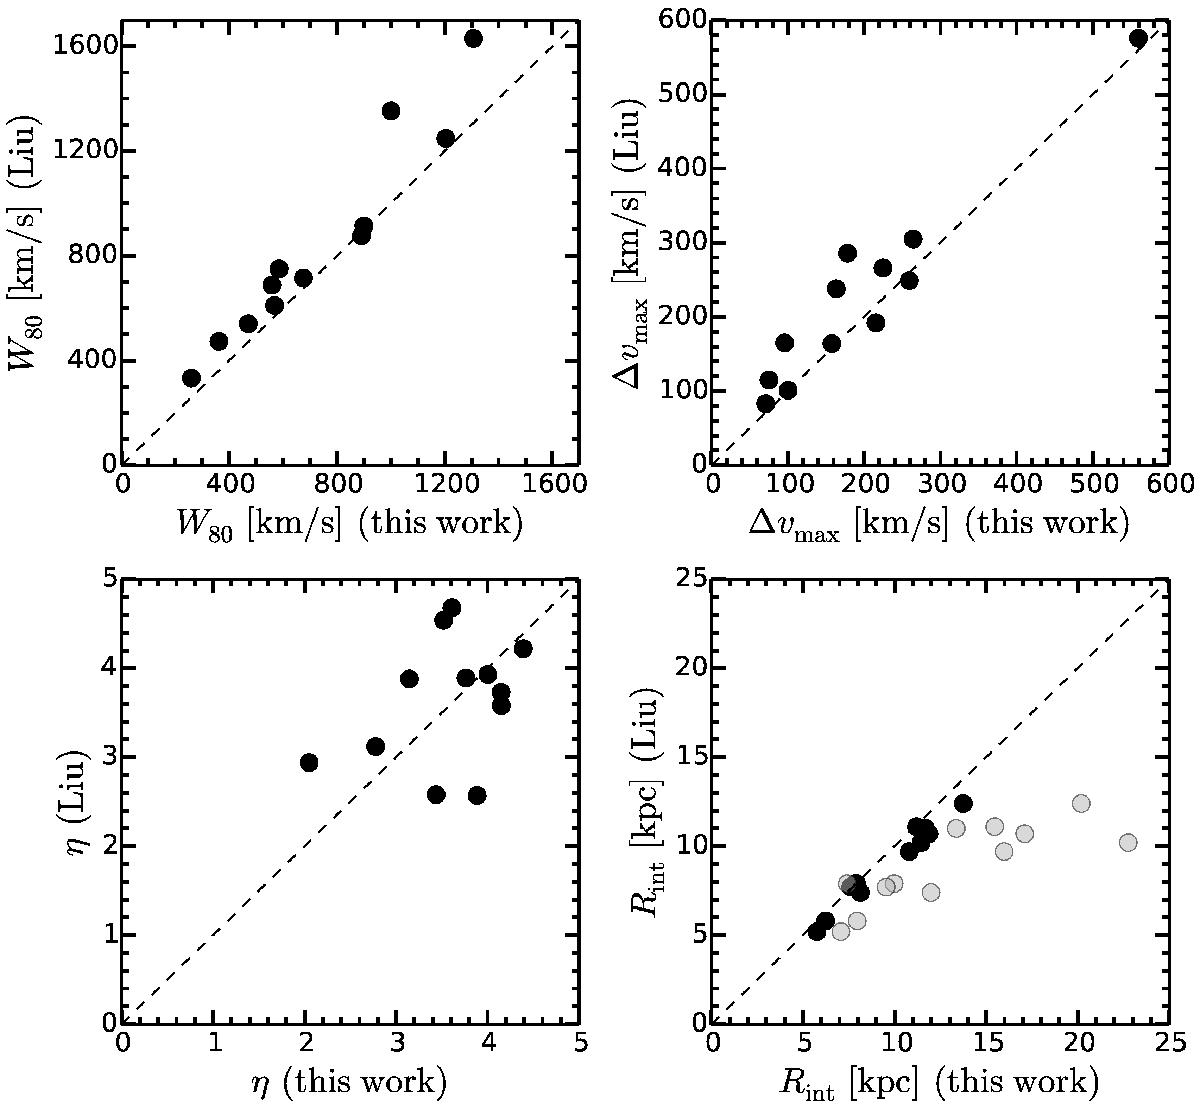
Comparison of the total [O iii] line width (W80, upper left panel), maximum velocity range (Δv, upper right panel), size of the ENLR (Rint, lower right panel), and the power-law slope of the total [O iii] surface brightness profile (η, lower left panel) from the QSO as measured by Liu et al. (2014) and our re-analysis. We find good agreement between measurements with only a weak systematic offset and a scatter consistent with the intrinsic accuracy of measurements. The surface brightness profile slope η shows the greatest scatter because the actual range of the outer profile to measure η is not clearly specified in Liu et al. (2014), so that our measurements are likely not exactly matching their methodology. For the ENLR we measure the isophotal radius at a surface brightness (corrected for cosmological dimming) of Σ[O iii] = 10-15 erg s-1 cm-2 arcsec-2 (black circles) and the maximum projected distance to spaxels which exhibit the same threshold surface brightness locally (grey symbols).
Current usage metrics show cumulative count of Article Views (full-text article views including HTML views, PDF and ePub downloads, according to the available data) and Abstracts Views on Vision4Press platform.
Data correspond to usage on the plateform after 2015. The current usage metrics is available 48-96 hours after online publication and is updated daily on week days.
Initial download of the metrics may take a while.