Fig. 4
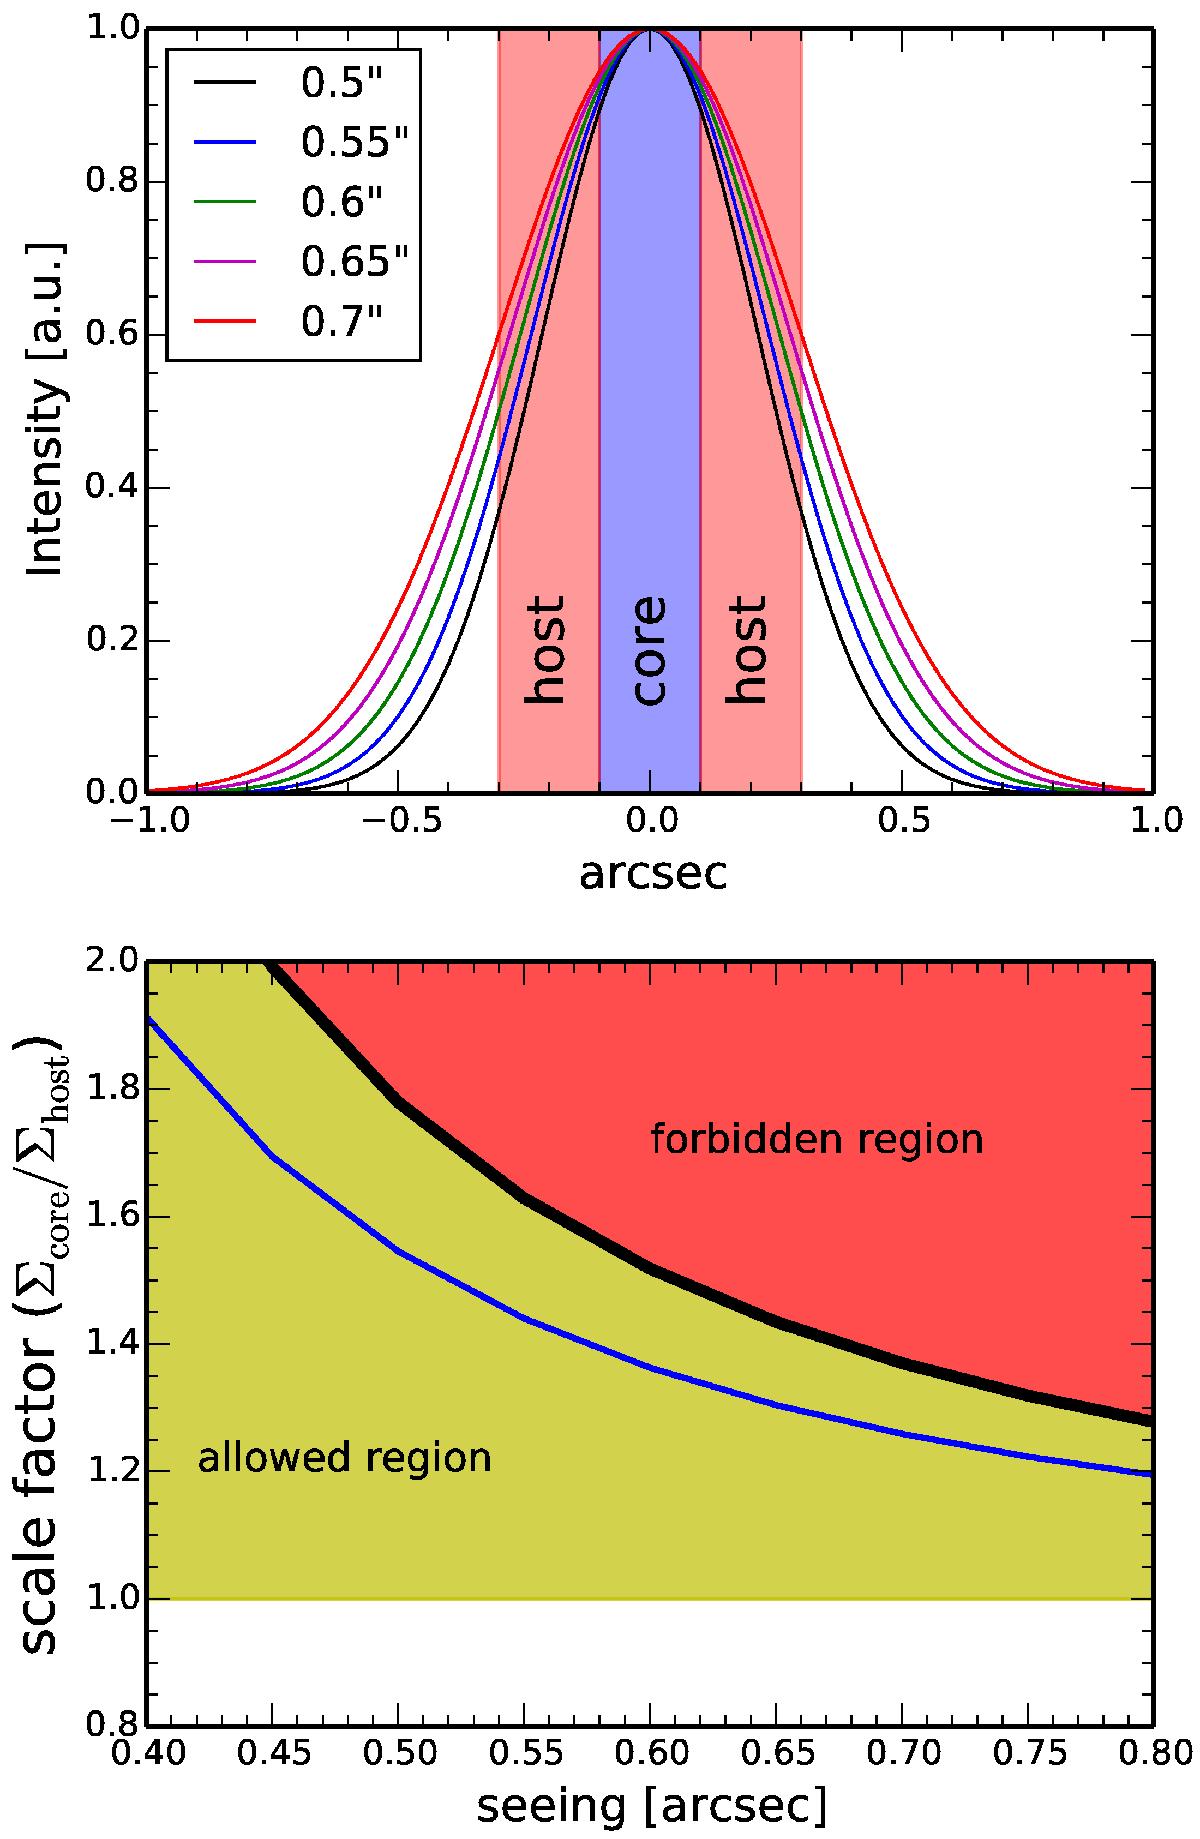
Upper panel: intensity profile for various seeing conditions assuming a Gaussian shape. The region of the central spaxel (core) and the adjacent host galaxy spaxel (host) are indicated by shaded areas for the GMOS sampling. Lower panel: corresponding scale factors for a point-source as a function seeing is shown by the black line. Higher scale factors would imply surface brightness distributions steeper than point-like sources (red shaded area).
Current usage metrics show cumulative count of Article Views (full-text article views including HTML views, PDF and ePub downloads, according to the available data) and Abstracts Views on Vision4Press platform.
Data correspond to usage on the plateform after 2015. The current usage metrics is available 48-96 hours after online publication and is updated daily on week days.
Initial download of the metrics may take a while.