Fig. 3
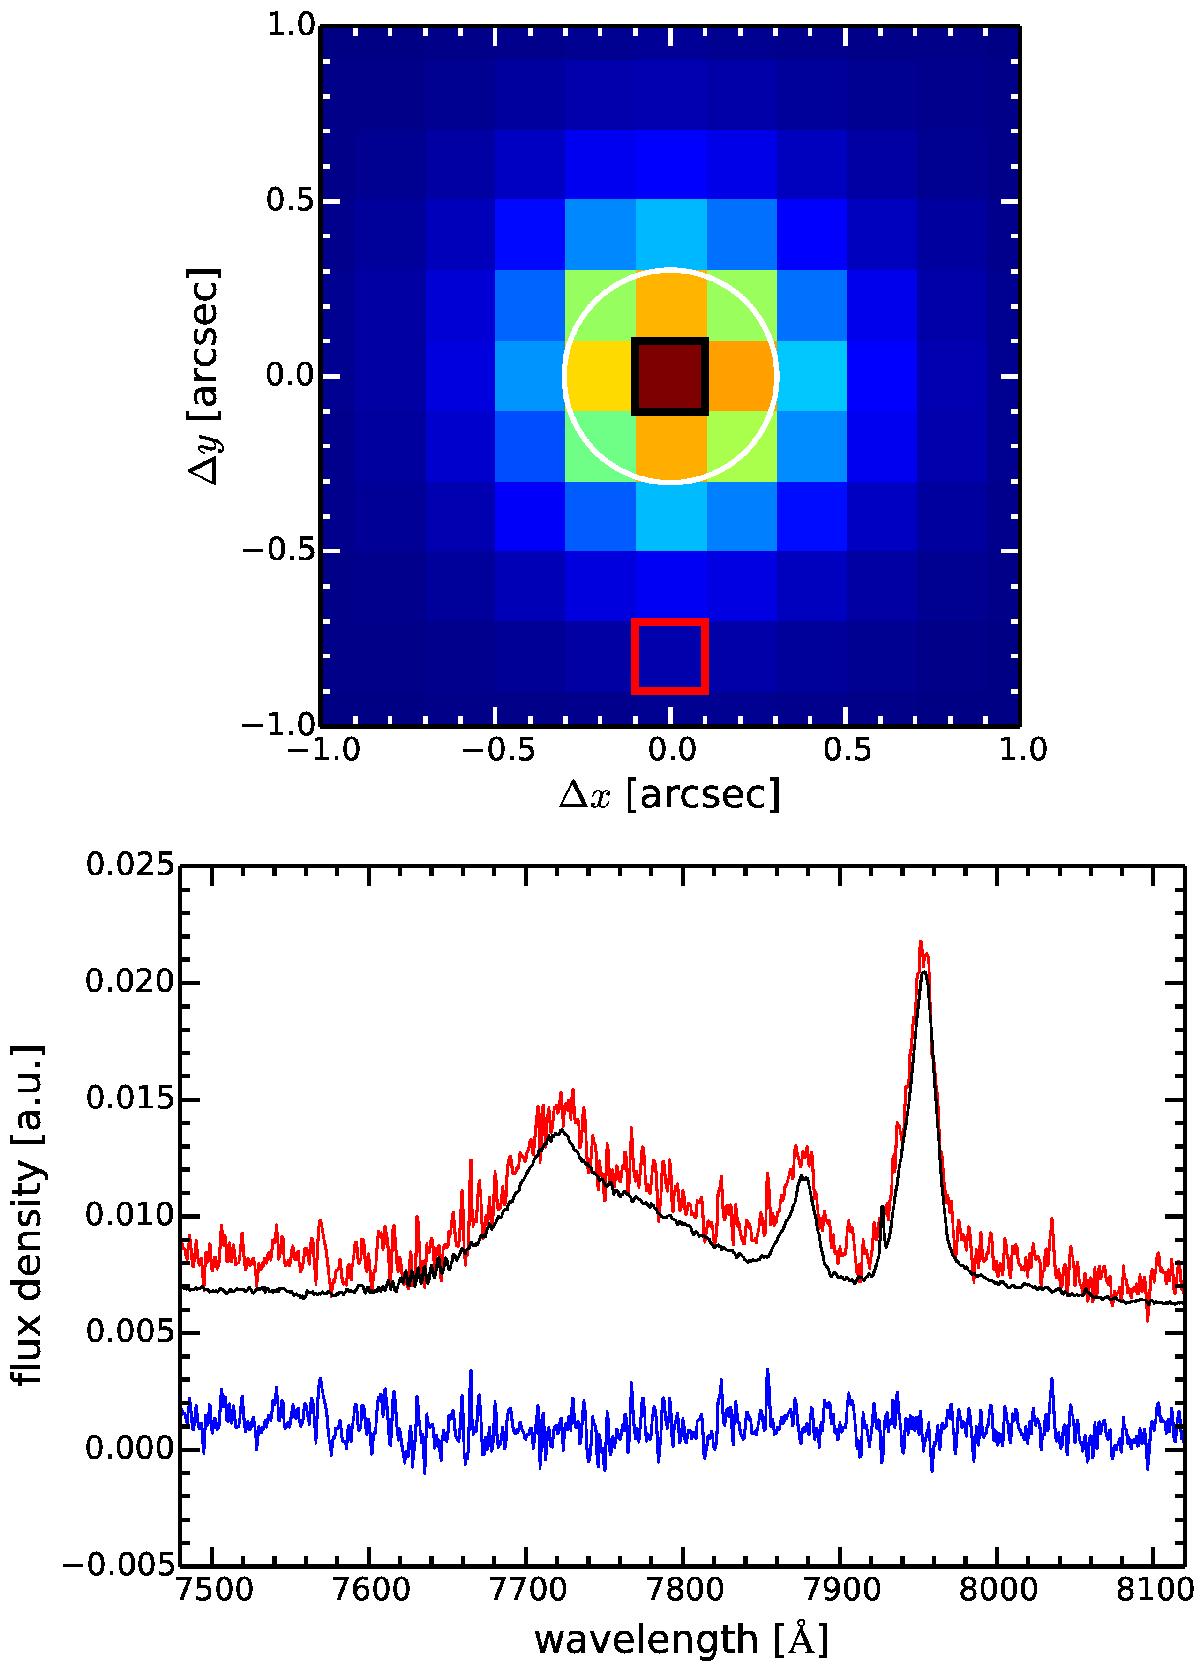
Upper panel: example PSF estimated from the intensity of the broad Hβ line for SDSS J0924+0642. The white circle indicates the FWHM of the seeing. We highlight two spaxels with a black and red square for which we show the spectra from the datacube in the lower panels. The red spaxel is ![]() (5.8 kpc) away from the QSO position. Lower panel: spectra from the two spaxels highlighted in the upper panel. The central spaxel spectrum is scaled in to match in the integrated broad Hβ flux of outer spectrum. The difference between the spectra are indicated by the blue line and shows that both spectra are identical in shape except of a constant continuum offset across the wavelength range. Any apparent emission line contribution in the red spaxel is simply due to beam smearing of an unresolved source even for the forbidden [O iii] line from the NLR.
(5.8 kpc) away from the QSO position. Lower panel: spectra from the two spaxels highlighted in the upper panel. The central spaxel spectrum is scaled in to match in the integrated broad Hβ flux of outer spectrum. The difference between the spectra are indicated by the blue line and shows that both spectra are identical in shape except of a constant continuum offset across the wavelength range. Any apparent emission line contribution in the red spaxel is simply due to beam smearing of an unresolved source even for the forbidden [O iii] line from the NLR.
Current usage metrics show cumulative count of Article Views (full-text article views including HTML views, PDF and ePub downloads, according to the available data) and Abstracts Views on Vision4Press platform.
Data correspond to usage on the plateform after 2015. The current usage metrics is available 48-96 hours after online publication and is updated daily on week days.
Initial download of the metrics may take a while.