Fig. 2
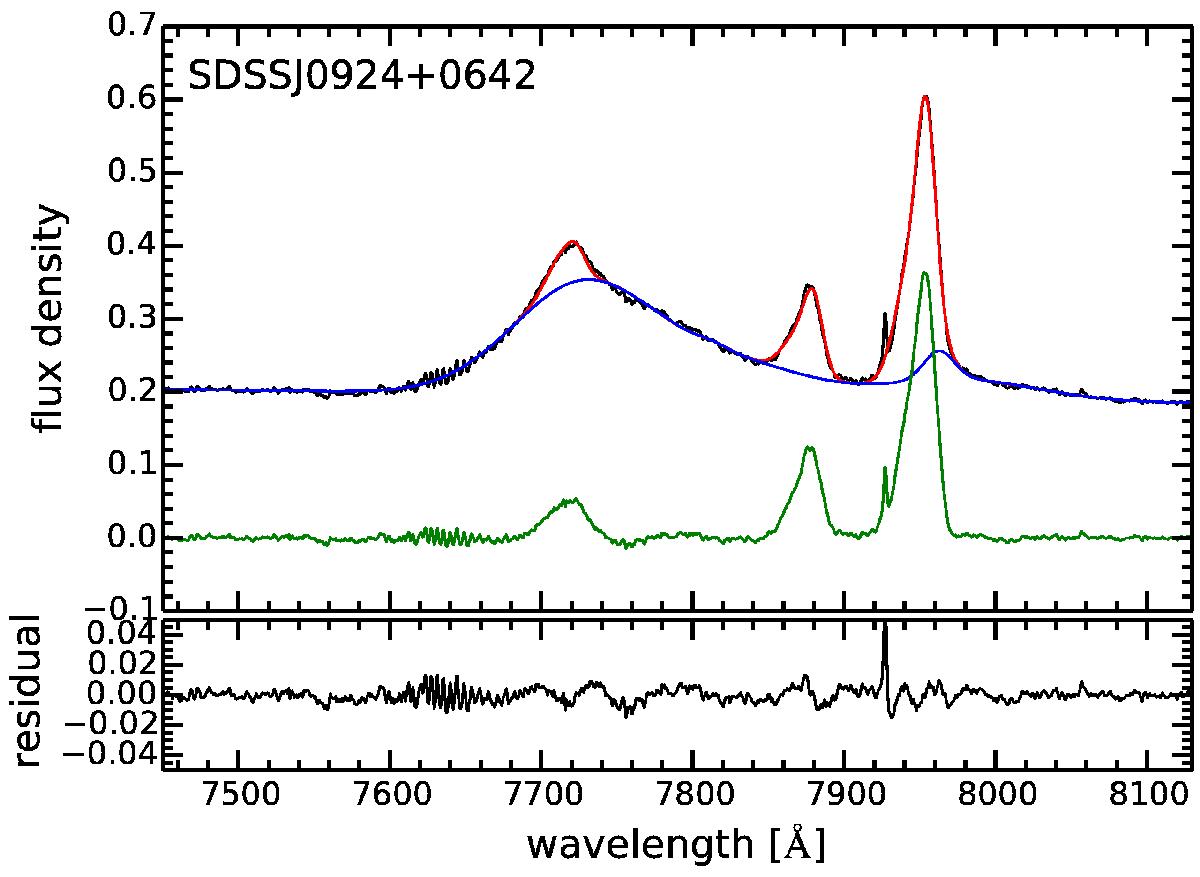
Example of the broad Hβ and Fe ii emission-line subtraction without QSO-host deblending for SDSS J0924+0642. The observed spectrum (black line) and our best-fit model (red line) are shown in the upper panel. The best-fit model consisting of the broad Hβ and Fe ii λλ4948,5017 plus continuum is represented by the blue line with the corresponding residual spectrum of the narrow Hβ and [O iii] λλ4960,5007 indicated by the green line. The residuals of the total model are shown in the panel below. Details of the assumed model are given in the main text.
Current usage metrics show cumulative count of Article Views (full-text article views including HTML views, PDF and ePub downloads, according to the available data) and Abstracts Views on Vision4Press platform.
Data correspond to usage on the plateform after 2015. The current usage metrics is available 48-96 hours after online publication and is updated daily on week days.
Initial download of the metrics may take a while.