Fig. A.2
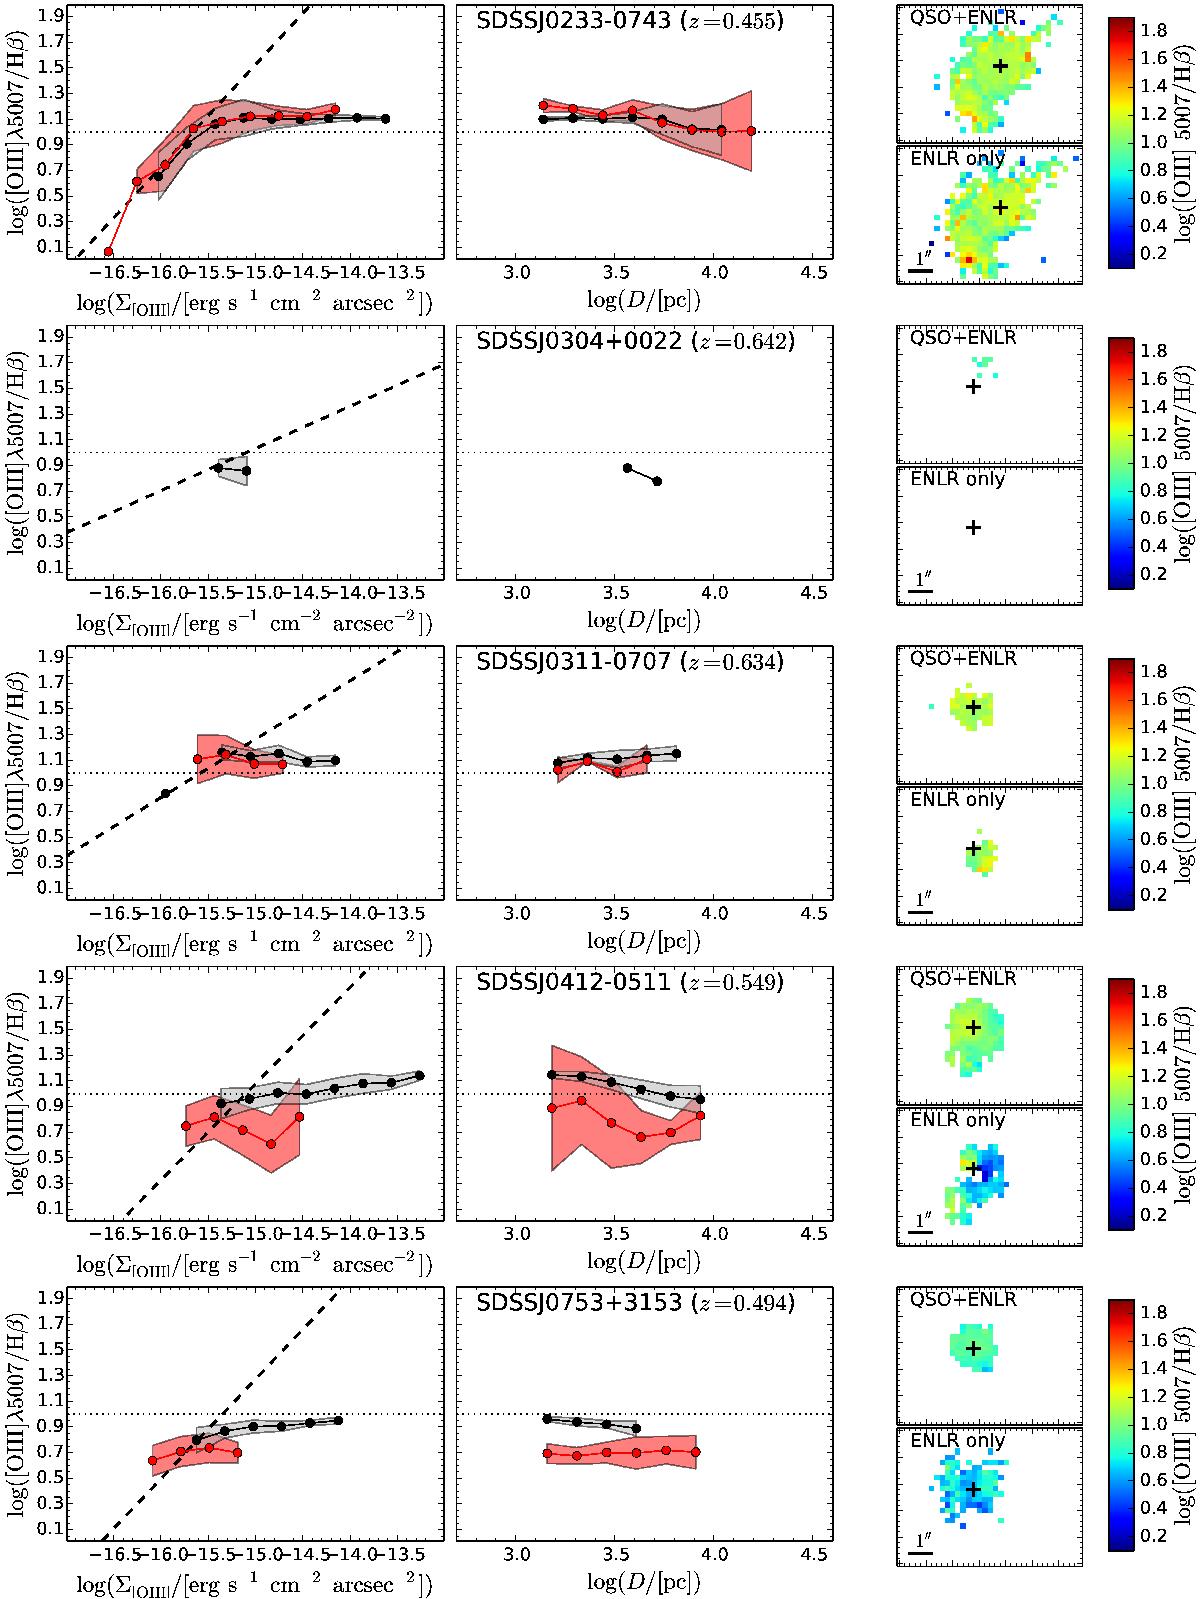
Left panel: emission-line ratio of [O iii]/Hβ as a function of [O iii] surface brightness for the original data after removing the broad Hβ line (black data points) and after performing the QSO-host galaxy deblending (red data points). The shaded area indicates the rms of line ratios within a given bin. The dashed line indicates the 3σ detect limit for Hβ for a given [O iii]/Hβ ratio given the estimated noise in the unblended data. Middle panel: line ratios as a function of distance D from the QSOs. Right panel: line ratio maps before and after the QSO-host galaxy deblending.
Current usage metrics show cumulative count of Article Views (full-text article views including HTML views, PDF and ePub downloads, according to the available data) and Abstracts Views on Vision4Press platform.
Data correspond to usage on the plateform after 2015. The current usage metrics is available 48-96 hours after online publication and is updated daily on week days.
Initial download of the metrics may take a while.