Fig. A.1
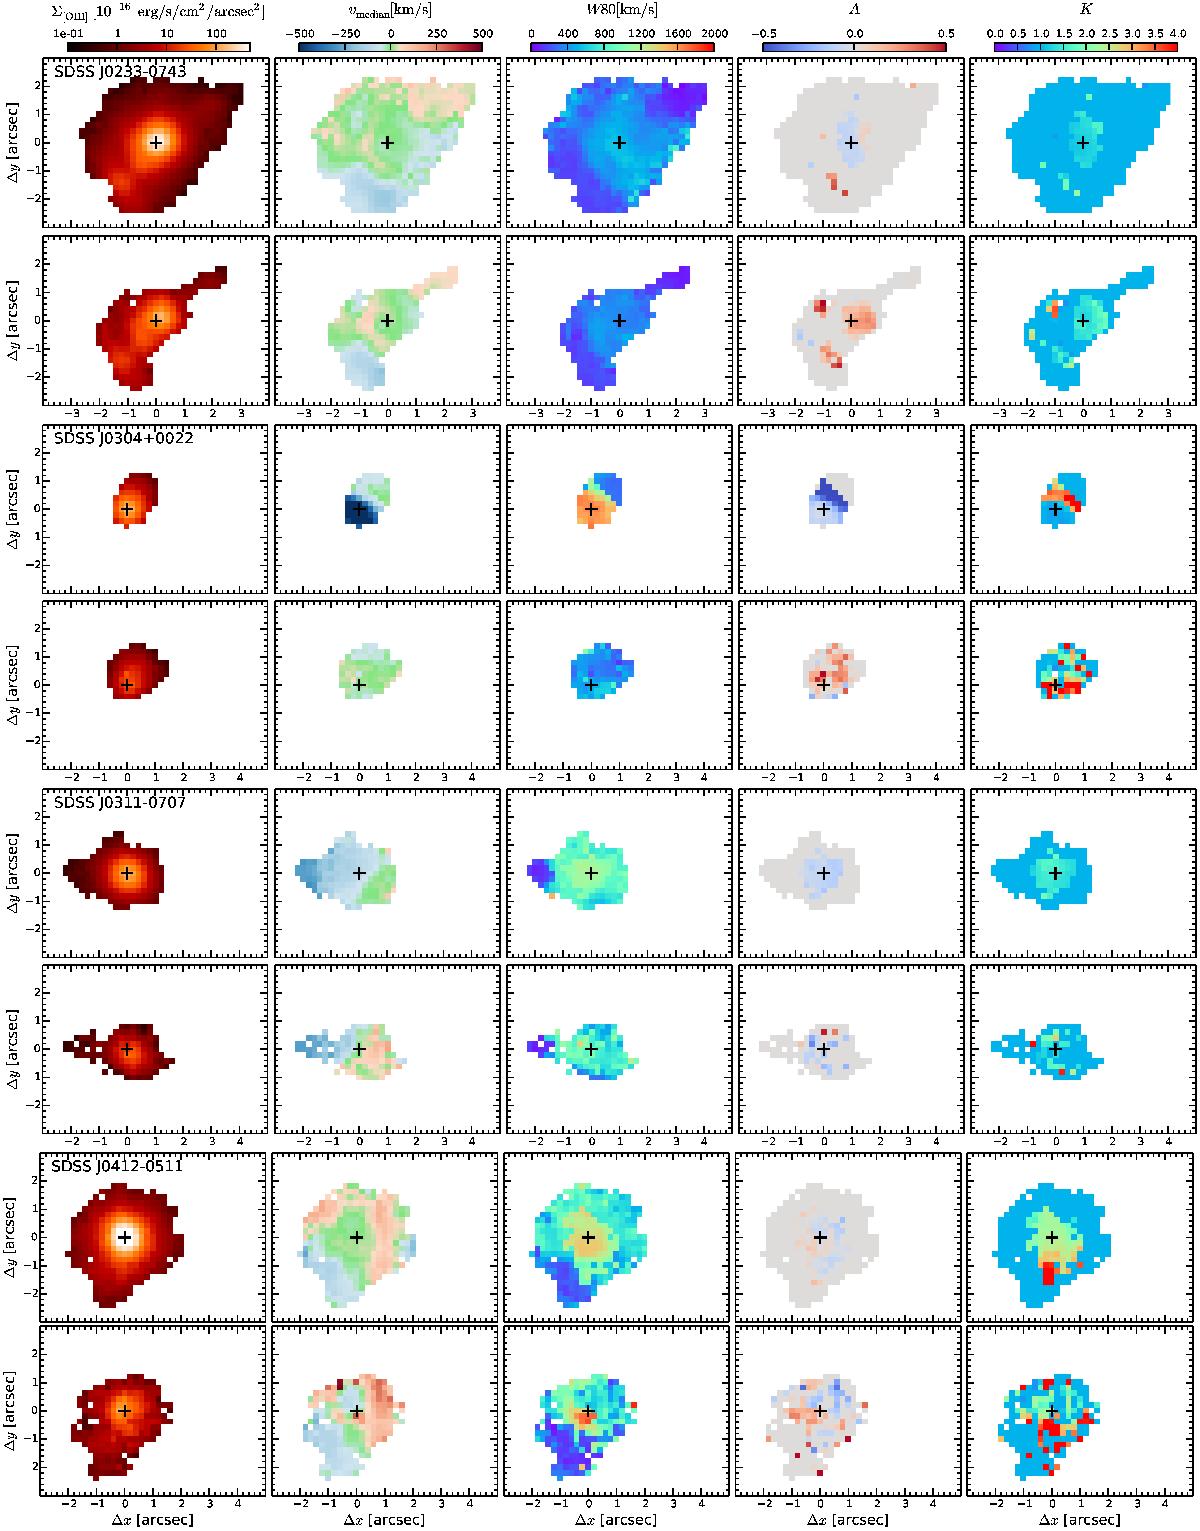
Comparison of spatially resolved emission-line parameters across the GMOS FoV before (upper panels) and after (lower panels) applying the QSO-host galaxy deblending for each QSO. From left to right we present the [O iii] surface brightness distribution (Σ[O iii]), the median line velocity (vmedian), the line width covering 80 per cent of the line flux (W80), the line asymmetry parameter (A), and the kurtosis parameter (K).
Current usage metrics show cumulative count of Article Views (full-text article views including HTML views, PDF and ePub downloads, according to the available data) and Abstracts Views on Vision4Press platform.
Data correspond to usage on the plateform after 2015. The current usage metrics is available 48-96 hours after online publication and is updated daily on week days.
Initial download of the metrics may take a while.