Fig. 1
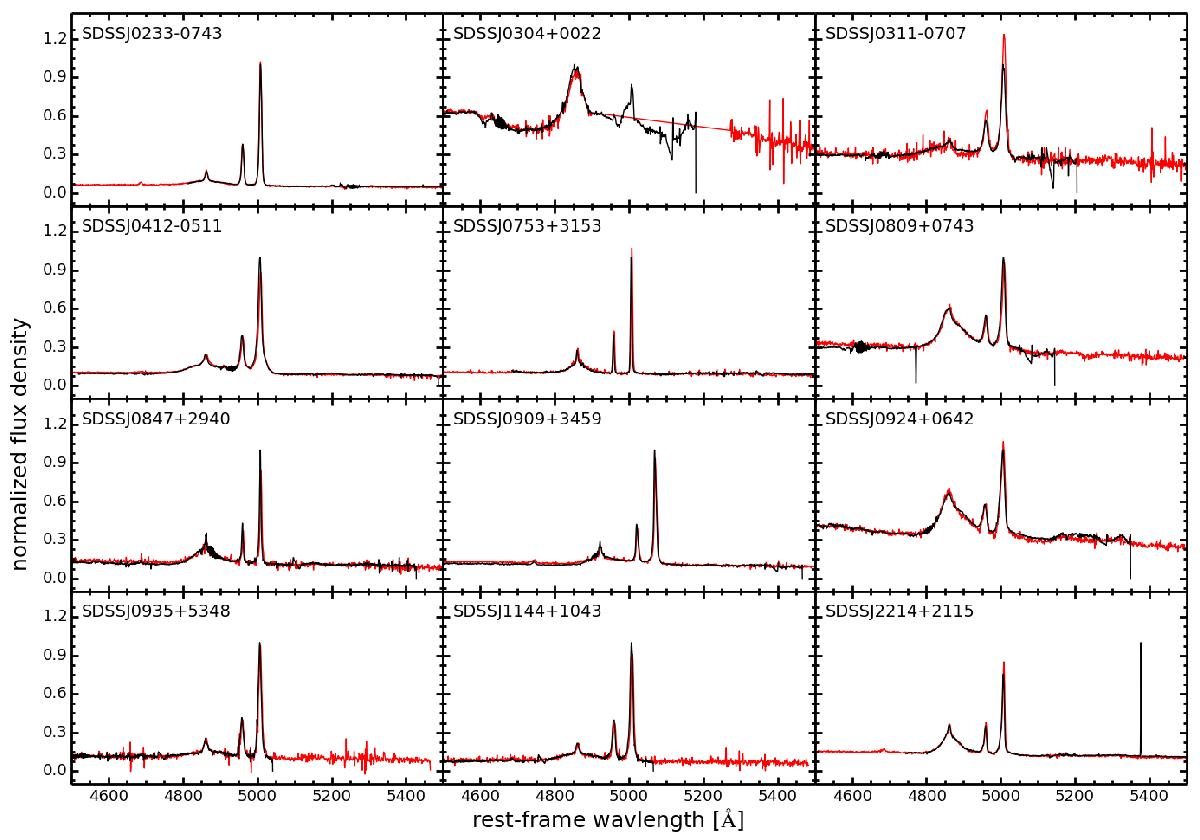
Comparison of the GMOS 3′′ aperture spectra (black line) with the corresponding SDSS spectrum (red line). The wavelength range is limited to the rest-frame wavelength range between 4500 and 5500 Å. An absolute photometric calibration of the GMOS data based on the median of the ratio of spectra over the common wavelength range. The spectra are normalized in flux density so that the peak in the [O iii] λ5007 line is set to one in the SDSS spectrum. A large part of the SDSS spectrum of SDSS J0304+0022 is masked as bad, as seen as the linear interpolated region. In general, the relative GMOS flux calibration across the wavelength range is consistent with the SDSS spectra at a <10% level.
Current usage metrics show cumulative count of Article Views (full-text article views including HTML views, PDF and ePub downloads, according to the available data) and Abstracts Views on Vision4Press platform.
Data correspond to usage on the plateform after 2015. The current usage metrics is available 48-96 hours after online publication and is updated daily on week days.
Initial download of the metrics may take a while.