Fig. 9
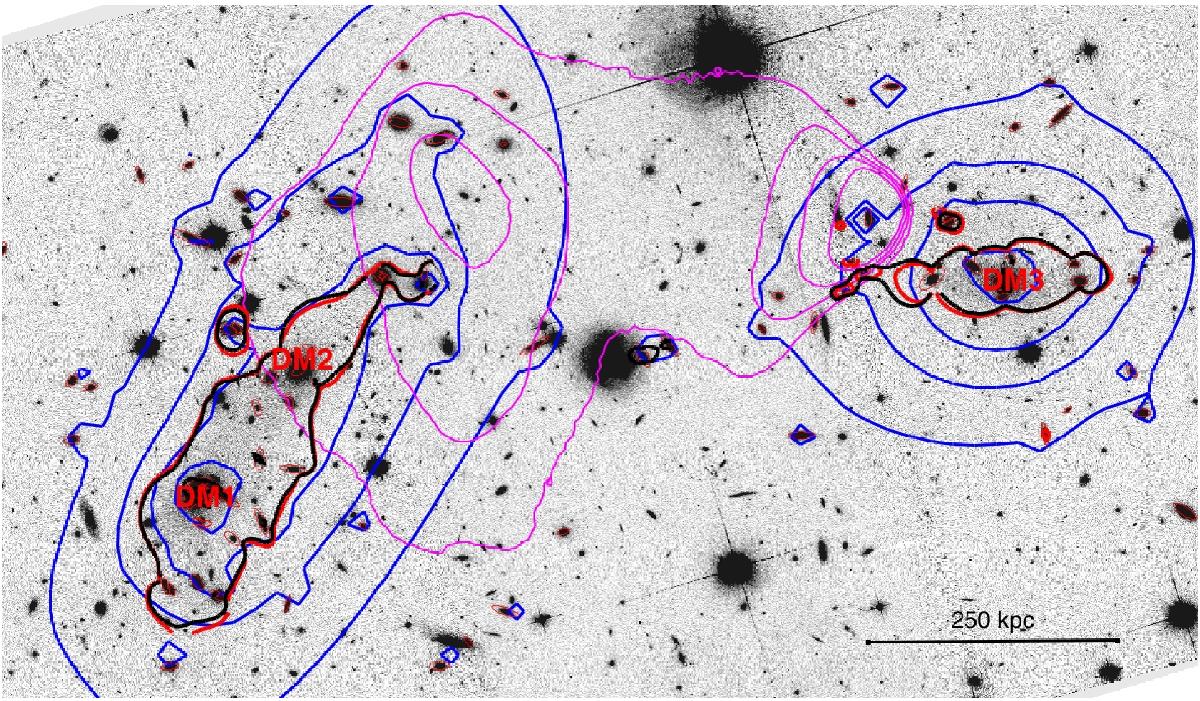
F606W-band image of the Bullet cluster. The size of the field of view is 150″ × 250″. The blue contours show the projected mass density. The red line represents a critical line calculated using Faber-Jackson scaling relation to all cluster members while black line represents the result from use of the scaling relation, fundamental plane. The magenta lines represent the contours of the Chandra X-rays brightness map.
Current usage metrics show cumulative count of Article Views (full-text article views including HTML views, PDF and ePub downloads, according to the available data) and Abstracts Views on Vision4Press platform.
Data correspond to usage on the plateform after 2015. The current usage metrics is available 48-96 hours after online publication and is updated daily on week days.
Initial download of the metrics may take a while.