Fig. 7
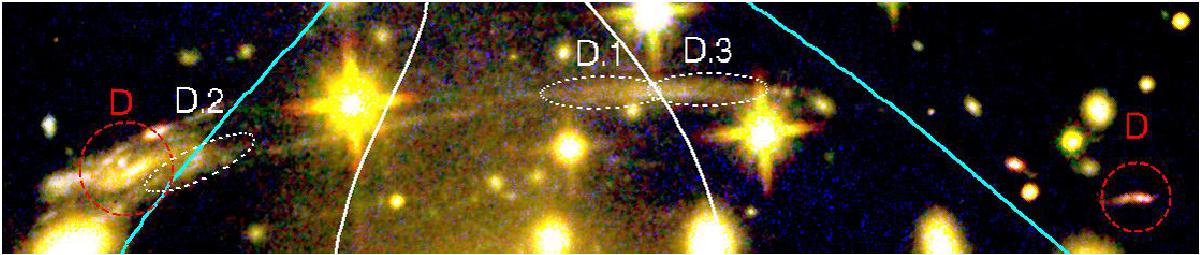
Multiply-imaged system D, a giant arc, identified in the cluster area with the ACS images, as shown in Fig. 1. Multiple images marked with red dashed line circles mark the positions of images of system D as reported by Bradač et al. (2006). White ellipses mark the positions of multiple images of the D system predicted by our strong lensing mass model. The white line is the critical line at the model redshift corresponding to this candidate system (z = 3.23). Cyan lines mark limits of multiple image occurrence as predicted by our model.
Current usage metrics show cumulative count of Article Views (full-text article views including HTML views, PDF and ePub downloads, according to the available data) and Abstracts Views on Vision4Press platform.
Data correspond to usage on the plateform after 2015. The current usage metrics is available 48-96 hours after online publication and is updated daily on week days.
Initial download of the metrics may take a while.