Fig. 6
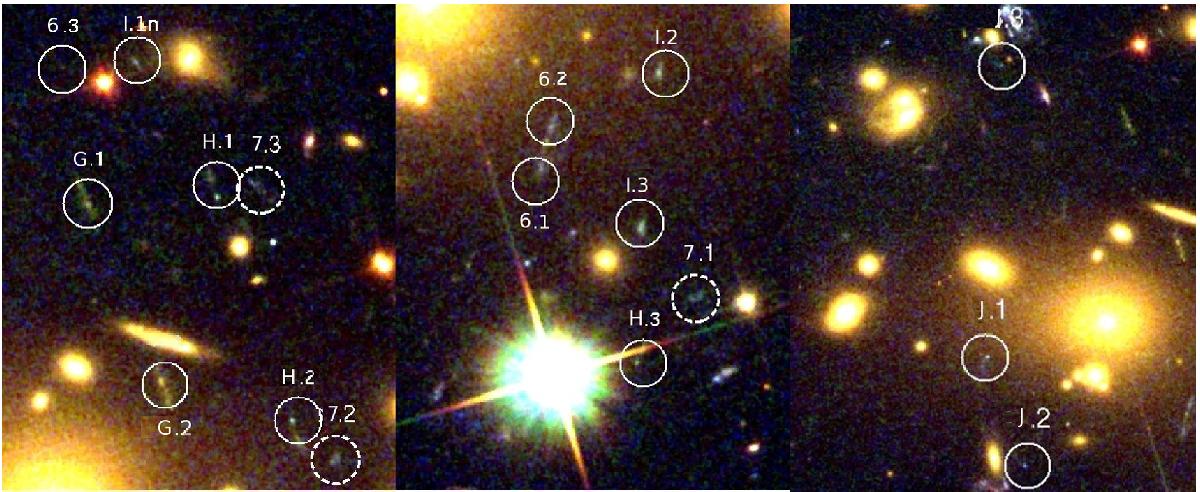
Multiple images identified in the sub cluster area with the ACS images, as shown in Fig. 2. Multiple images marked with dashed line circles mark the predicted but not confirmed positions of counter images. System 7 with dashed circle, is a multiply-imaged candidate and is not a part of model constraints due to large color uncertainties. The size of each box is 20″ × 12″, North is up and East is left.
Current usage metrics show cumulative count of Article Views (full-text article views including HTML views, PDF and ePub downloads, according to the available data) and Abstracts Views on Vision4Press platform.
Data correspond to usage on the plateform after 2015. The current usage metrics is available 48-96 hours after online publication and is updated daily on week days.
Initial download of the metrics may take a while.