Free Access
Fig. 5
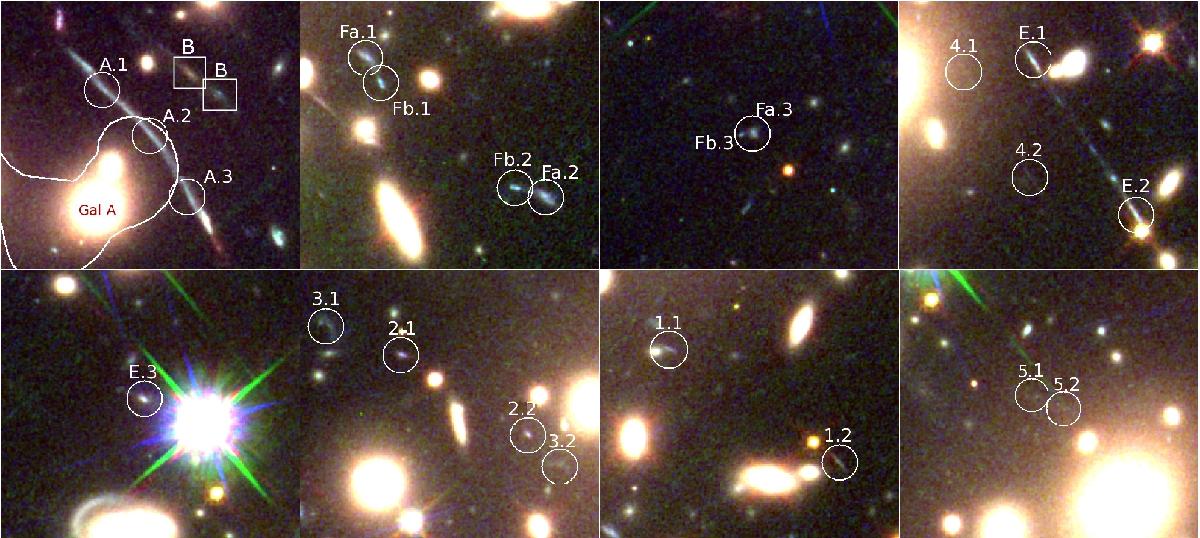
Multiple images identified in the main cluster area with the HST images, as shown in Fig. 1. System K is not shown since it is invisible in ACS/HST. The size of each box is 12″ × 12″, North is up and East is left.
Current usage metrics show cumulative count of Article Views (full-text article views including HTML views, PDF and ePub downloads, according to the available data) and Abstracts Views on Vision4Press platform.
Data correspond to usage on the plateform after 2015. The current usage metrics is available 48-96 hours after online publication and is updated daily on week days.
Initial download of the metrics may take a while.