Fig. 4
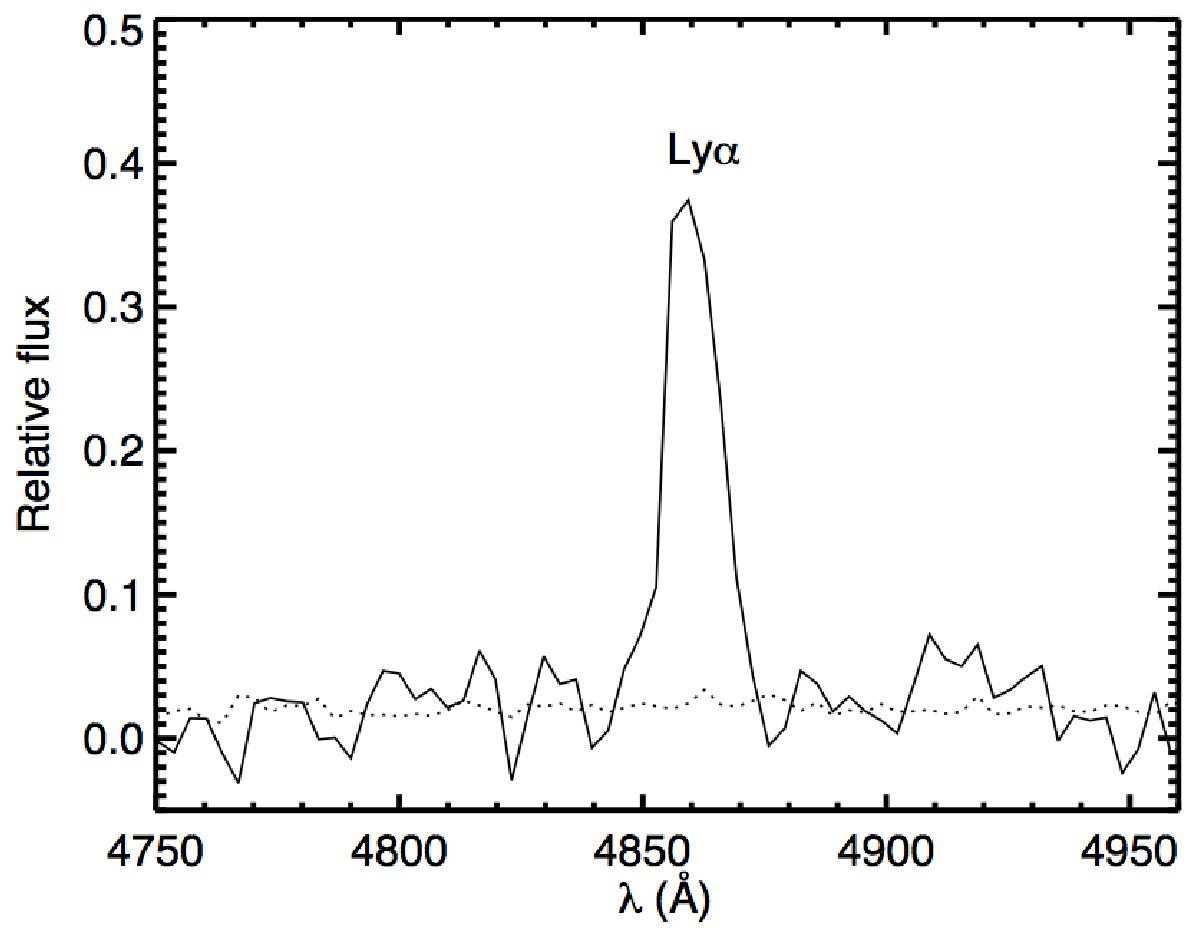
System H shows a strong emission line at 4851 Å which we interpret as Lyman-α at z = 2.99 from the lensing configuration and the lack of additional emission lines. The dotted line is the sky noise spectrum (no sky emission line are present in this wavelength range). The other likely alternative is [OII], observed at 4851 Å would give a redshift of 0.301, similar to the cluster redshift, thus the alternative can be excluded.
Current usage metrics show cumulative count of Article Views (full-text article views including HTML views, PDF and ePub downloads, according to the available data) and Abstracts Views on Vision4Press platform.
Data correspond to usage on the plateform after 2015. The current usage metrics is available 48-96 hours after online publication and is updated daily on week days.
Initial download of the metrics may take a while.