Free Access
Fig. 3
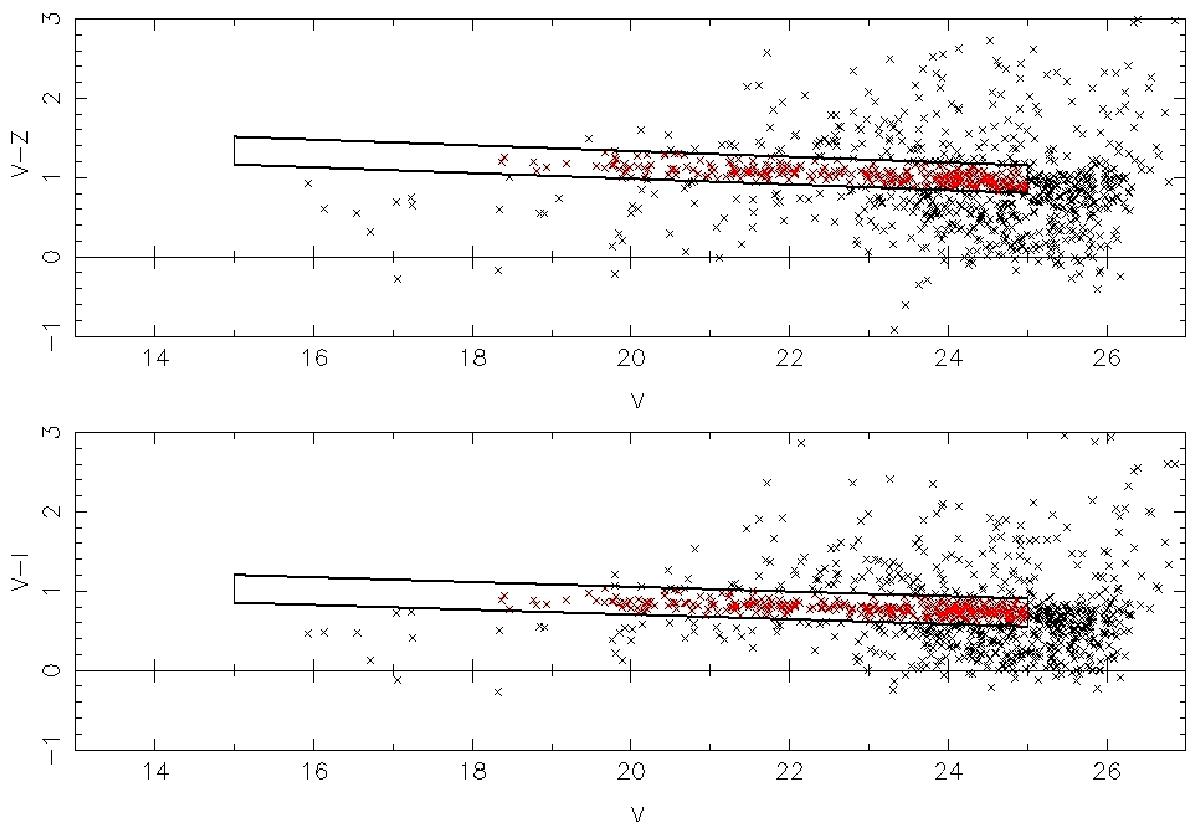
Color−magnitude diagrams and the selection of cluster member galaxies. The red sequence selection is shown in the black boxes: all galaxies in this box are considered to be cluster galaxies. [(V−I) vs. V] or [(V−z) vs. V] color−magnitude diagrams correspond to the main and sub-cluster components, respectively.
Current usage metrics show cumulative count of Article Views (full-text article views including HTML views, PDF and ePub downloads, according to the available data) and Abstracts Views on Vision4Press platform.
Data correspond to usage on the plateform after 2015. The current usage metrics is available 48-96 hours after online publication and is updated daily on week days.
Initial download of the metrics may take a while.