Fig. 2
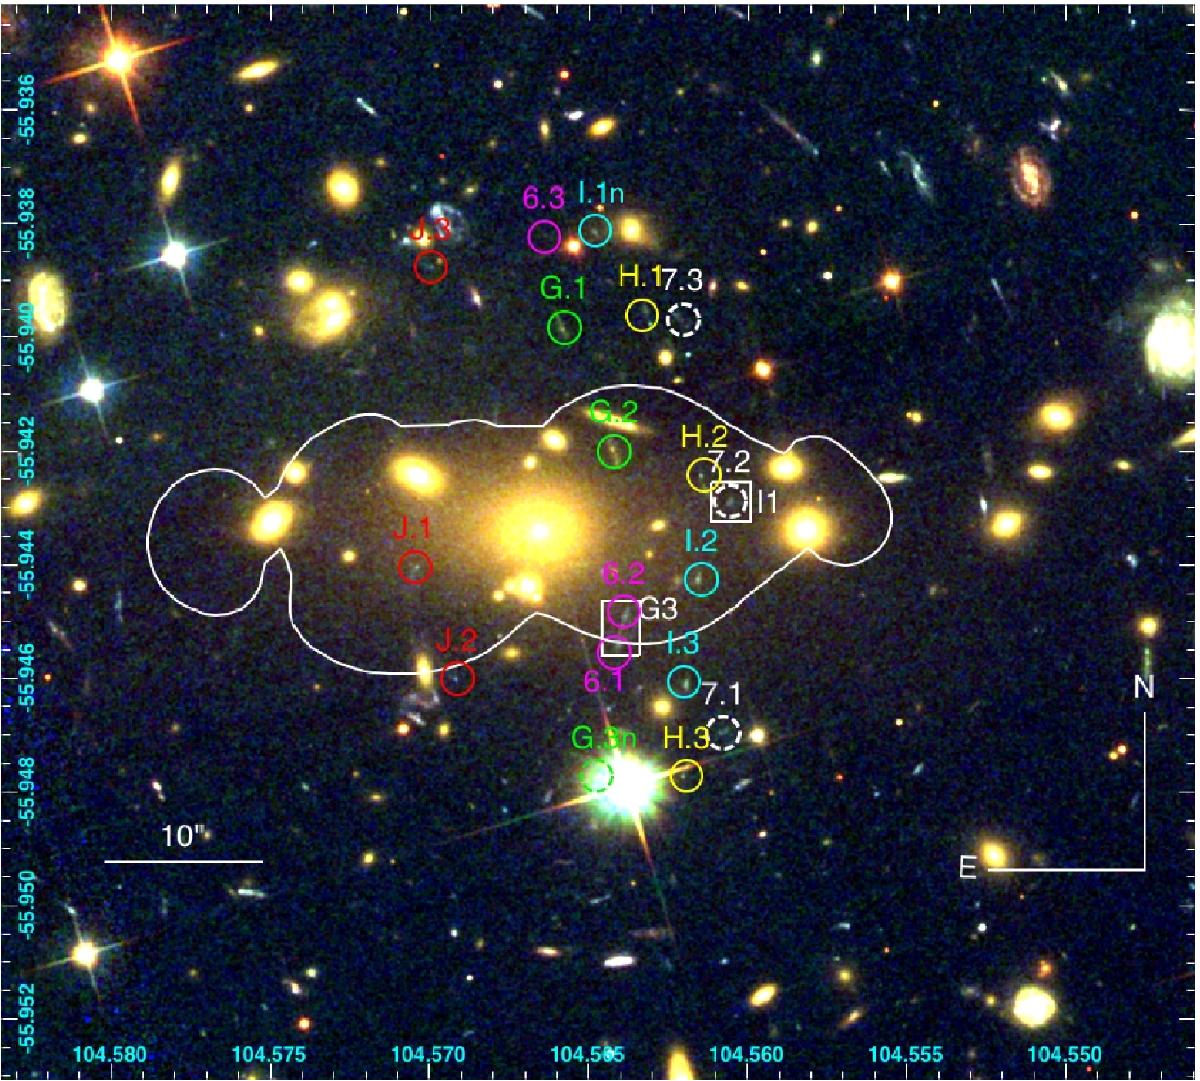
Color ACS/HST image of the sub cluster component of 1E 0657-56 (blue–F435W, green–F606W, red–F814W). Multiple images considered in this work are marked with color circles (dashed line circles mark the predicted but not confirmed positions of counter images). In this work, we spectroscopically measured a redshift of z = 2.99 for the multiply-imaged system H (see Sect. 2.3). System 7 (white dashed circle) is a multiply-imaged candidate and is not a part of model constraints due to large color uncertainties. The white line represents the critical line at redshift z = 2.99.
Current usage metrics show cumulative count of Article Views (full-text article views including HTML views, PDF and ePub downloads, according to the available data) and Abstracts Views on Vision4Press platform.
Data correspond to usage on the plateform after 2015. The current usage metrics is available 48-96 hours after online publication and is updated daily on week days.
Initial download of the metrics may take a while.