Fig. 1
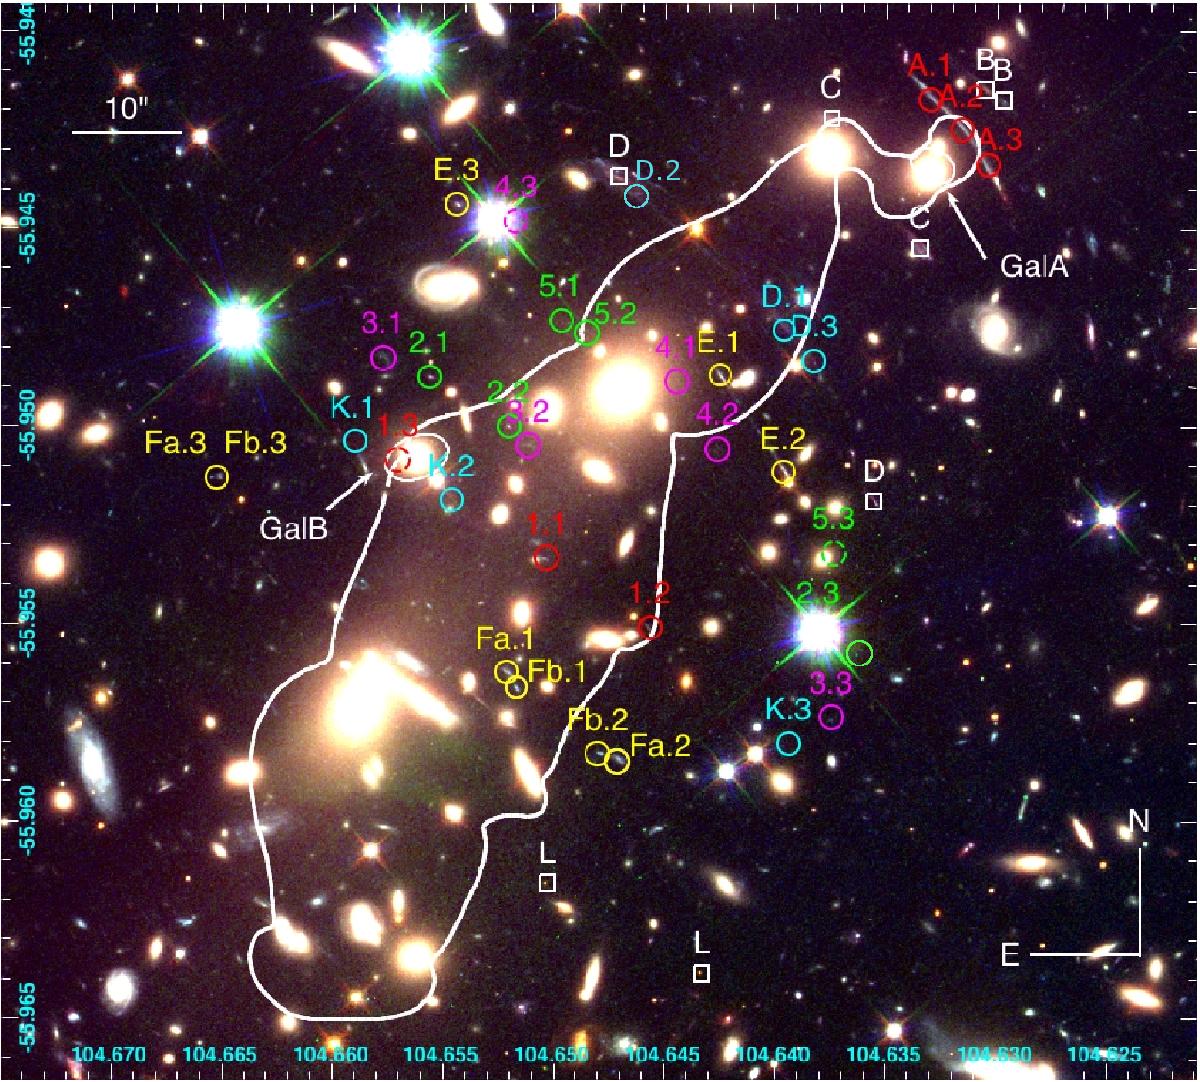
Color HST image of the main cluster component of 1E 0657-56 (blue–F606W, green–F814W, red–F160W). Multiple images considered in this work are marked with color circles (dashed line circles mark the predicted but not confirmed positions of counter images), the spectroscopically confirmed multiply-imaged systems are system A (Mehlert et al. 2001) and K (Gonzalez et al. 2010). White squares are referring to Bradač et al. (2009) systems, which we have revised and we did not include in our modeling. The new identification of system A is shown in red and the new identification of system D is shown in cyan (see also Fig. 7 ). System D is a multiply-imaged candidate and due to extended morphology is not a part of model constraints. The white line represents a critical line corresponding to z = 3.24.
Current usage metrics show cumulative count of Article Views (full-text article views including HTML views, PDF and ePub downloads, according to the available data) and Abstracts Views on Vision4Press platform.
Data correspond to usage on the plateform after 2015. The current usage metrics is available 48-96 hours after online publication and is updated daily on week days.
Initial download of the metrics may take a while.