Free Access
Fig. 14
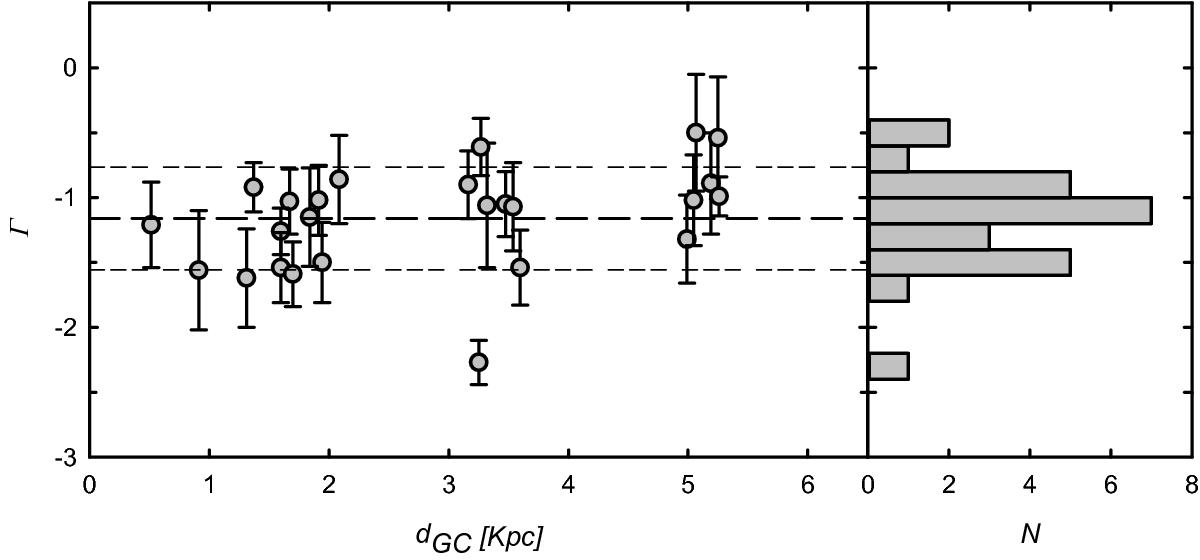
PDMF behavior for the most important groups found in NGC 300 (see text for details). The long dashed line indicates the mean slope value, and the short dashed lines show the envelopes at one standard deviation.
Current usage metrics show cumulative count of Article Views (full-text article views including HTML views, PDF and ePub downloads, according to the available data) and Abstracts Views on Vision4Press platform.
Data correspond to usage on the plateform after 2015. The current usage metrics is available 48-96 hours after online publication and is updated daily on week days.
Initial download of the metrics may take a while.