Fig. 13
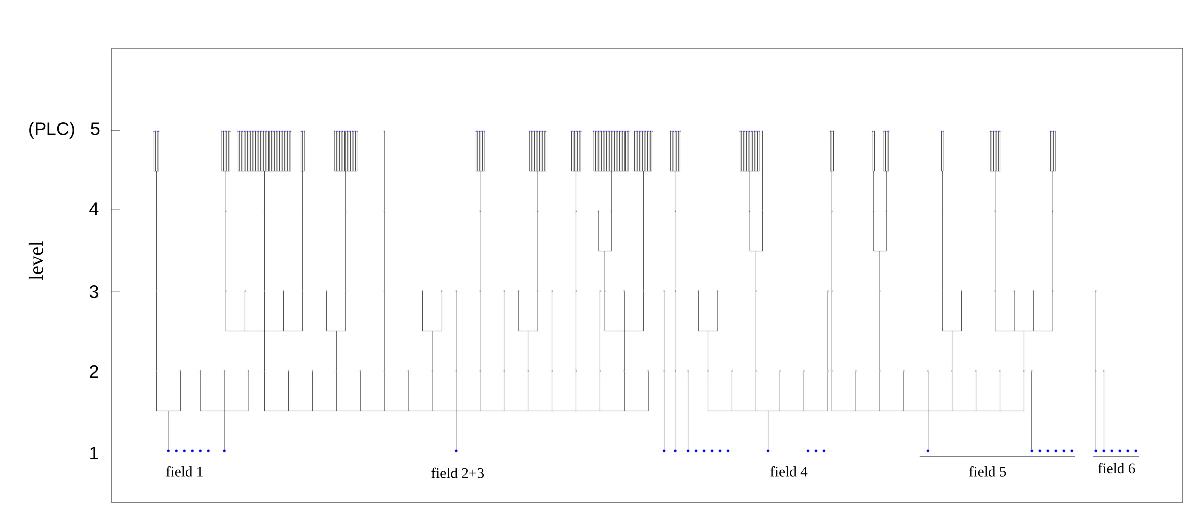
Dendrogram of the young stellar structures detected at different density level. Levels 1–4 correspond to a pixel value in the density maps of 40, 80, 110, and 145, respectively. Level 5 corresponds to the most compact cluster detected using PLC. The blue circles at the bottom indicate the structures detected at the lower density level. Some of them are no longer detected at higher densities.
Current usage metrics show cumulative count of Article Views (full-text article views including HTML views, PDF and ePub downloads, according to the available data) and Abstracts Views on Vision4Press platform.
Data correspond to usage on the plateform after 2015. The current usage metrics is available 48-96 hours after online publication and is updated daily on week days.
Initial download of the metrics may take a while.