Free Access
Fig. 12
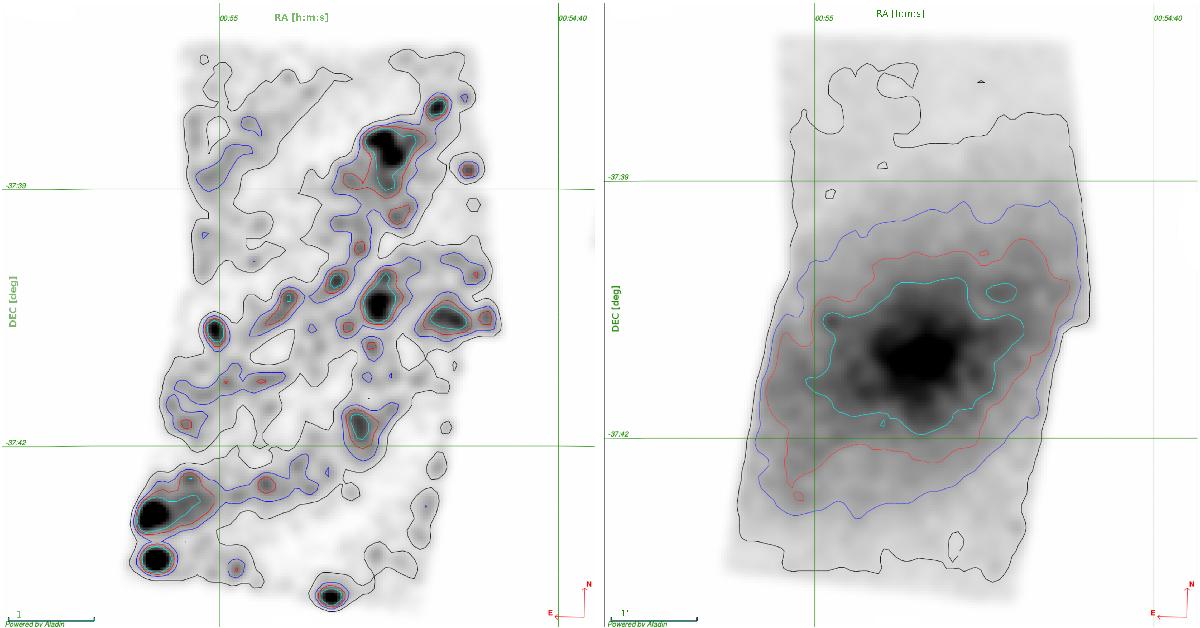
Density maps of central fields for the blue bright group (left panel) and the red bright group (right panel). The overlapping contours correspond to different pixel values, indicating different density levels: black 40, blue 80, red 110, and turquoise 145 stars per bin of 8 arcsec2.
This figure is made of several images, please see below:
Current usage metrics show cumulative count of Article Views (full-text article views including HTML views, PDF and ePub downloads, according to the available data) and Abstracts Views on Vision4Press platform.
Data correspond to usage on the plateform after 2015. The current usage metrics is available 48-96 hours after online publication and is updated daily on week days.
Initial download of the metrics may take a while.