Free Access
Fig. 9
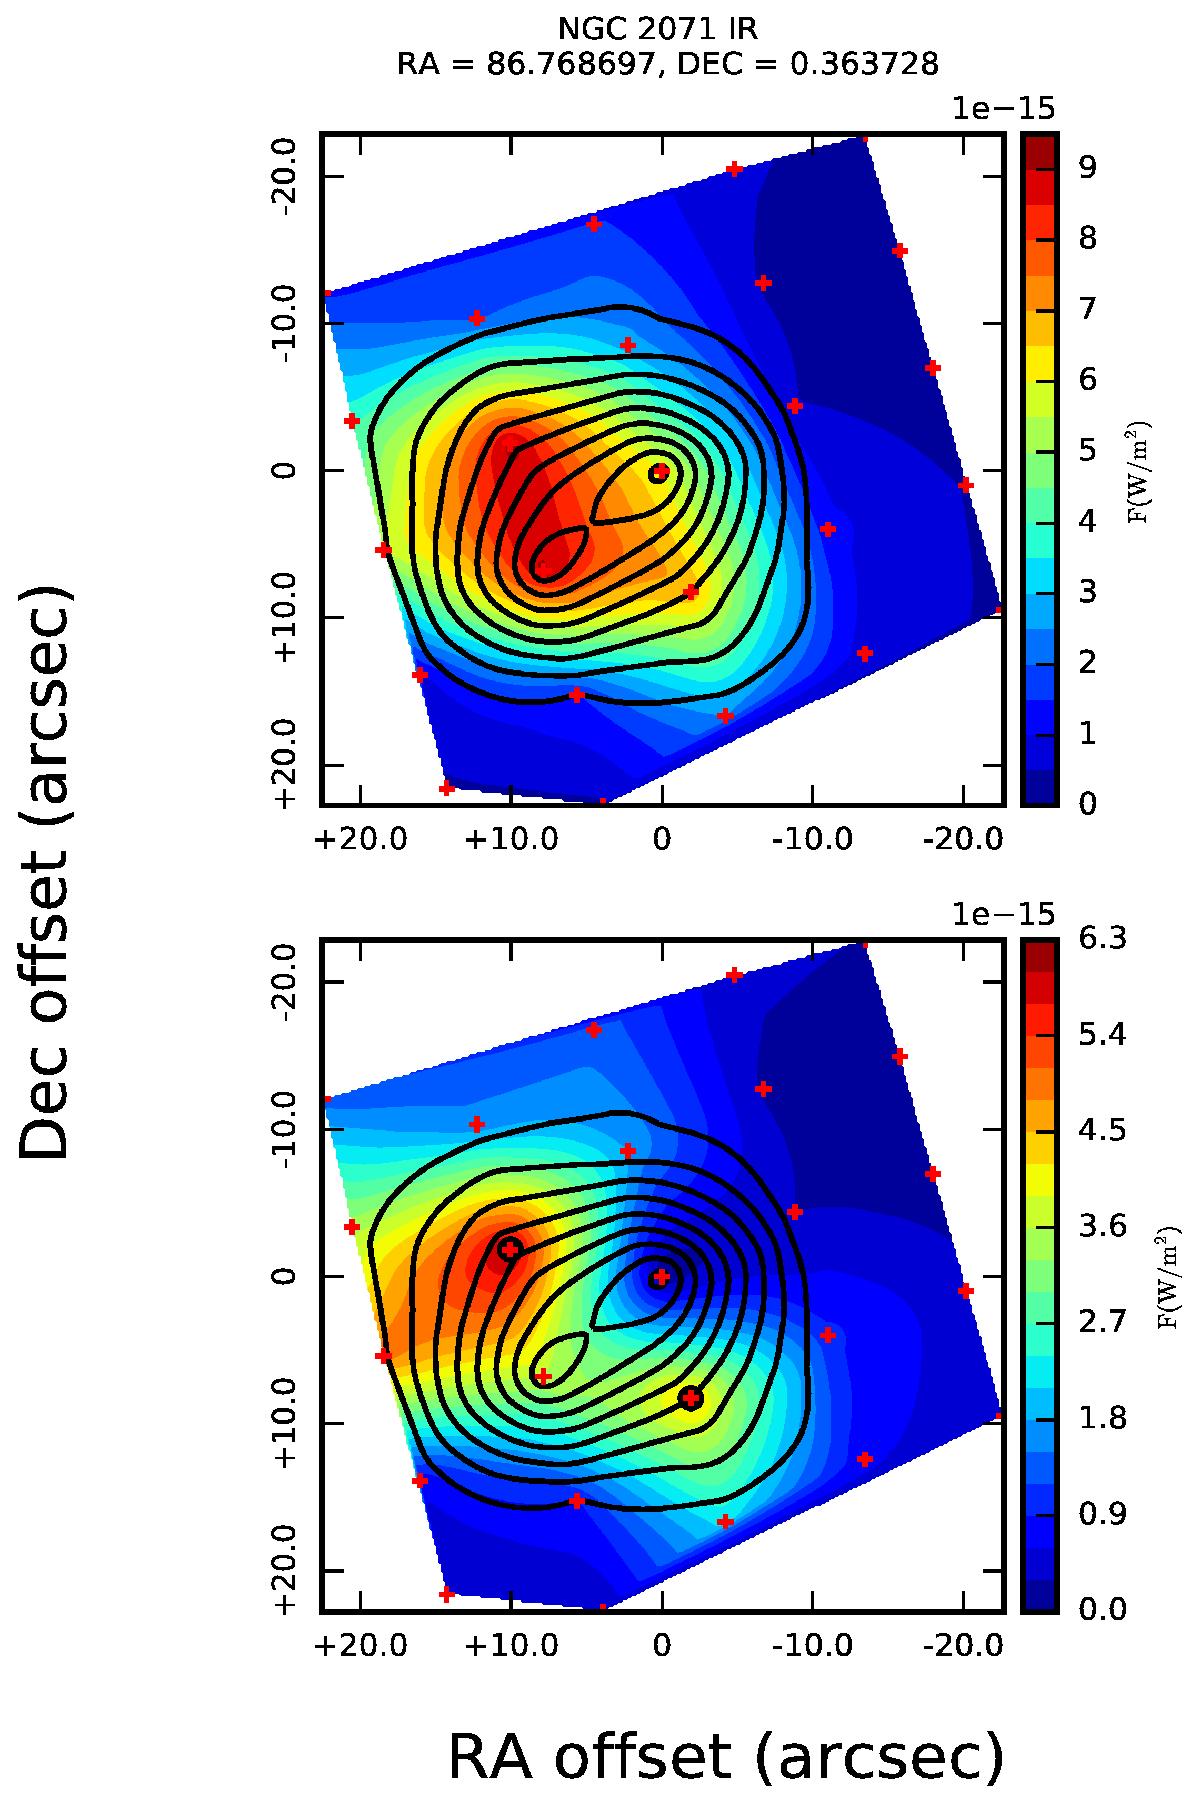
Top: o-H2O emission at 63 μm map for NGC 2071 IR. Bottom: residual map for o-H2O emission at 63 μm for NGC 2071 IR. The solid line contours depict the continuum emission in both panels.
Current usage metrics show cumulative count of Article Views (full-text article views including HTML views, PDF and ePub downloads, according to the available data) and Abstracts Views on Vision4Press platform.
Data correspond to usage on the plateform after 2015. The current usage metrics is available 48-96 hours after online publication and is updated daily on week days.
Initial download of the metrics may take a while.