Free Access
Fig. 6
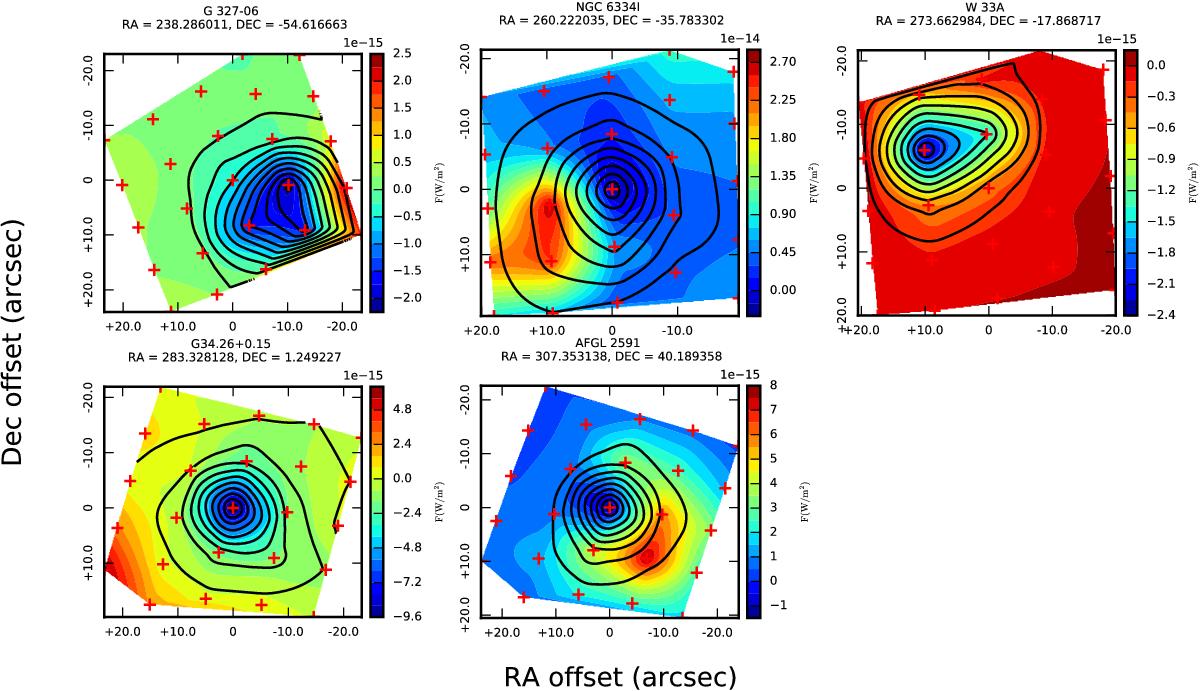
Line emission (coloured contours) and continuum maps at 63 μm (solid lines) for sources showing [OI] absorption at 63.185 μm. The crosses mark the position of individual spaxels.
Current usage metrics show cumulative count of Article Views (full-text article views including HTML views, PDF and ePub downloads, according to the available data) and Abstracts Views on Vision4Press platform.
Data correspond to usage on the plateform after 2015. The current usage metrics is available 48-96 hours after online publication and is updated daily on week days.
Initial download of the metrics may take a while.