Free Access
Fig. 4
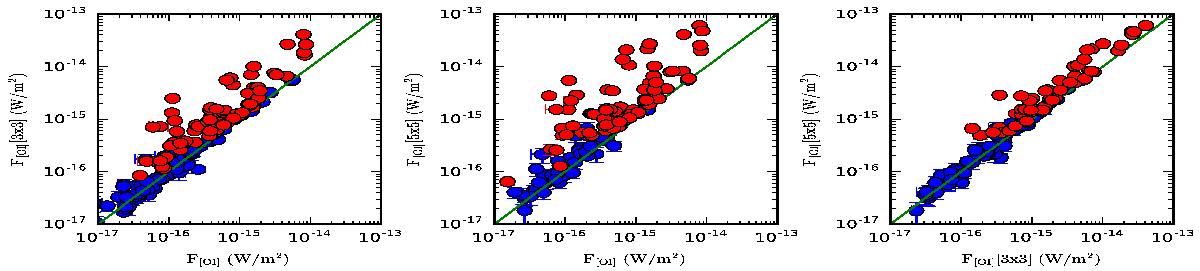
Extended emission tests for sources in the sample. Red dots identify sources showing extended emission in each of the tests. The solid diagonal line depicts a one-to-one ratio to help identify extended emission.
Current usage metrics show cumulative count of Article Views (full-text article views including HTML views, PDF and ePub downloads, according to the available data) and Abstracts Views on Vision4Press platform.
Data correspond to usage on the plateform after 2015. The current usage metrics is available 48-96 hours after online publication and is updated daily on week days.
Initial download of the metrics may take a while.