Fig. 16
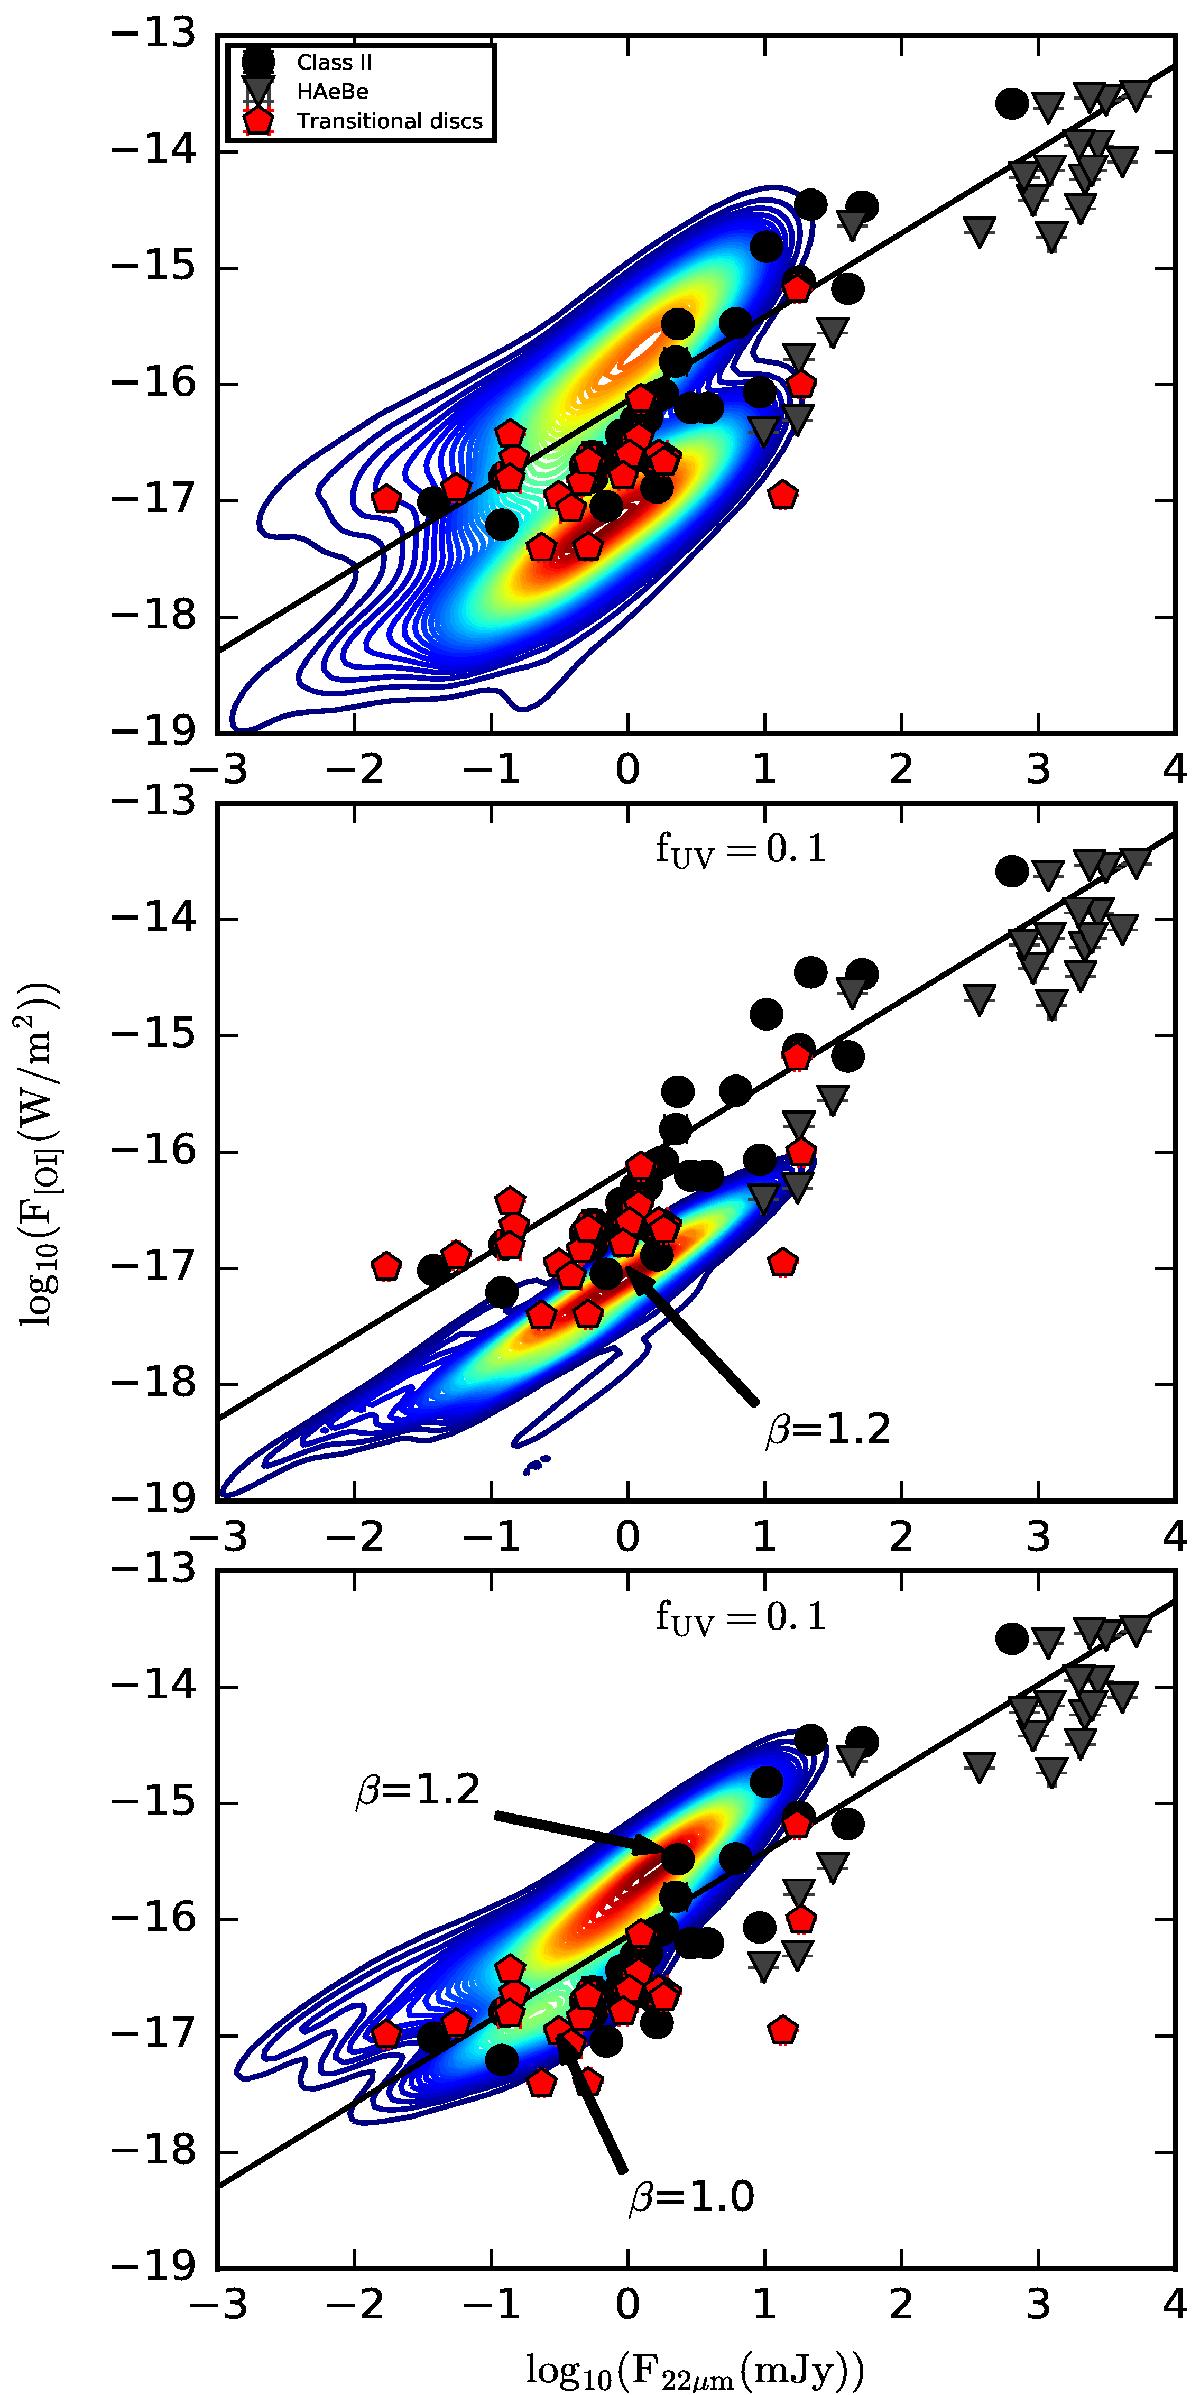
[OI] fluxes at 63 μm versus WISE flux at 22 μm: observations compared to models. The contours show the density of points for models from the DENT grid. Black dots show the position of observed Class II sources, red pentagons are transitional discs, and grey triangles are HAeBe stars. The top panel shows the whole distribution of selected models. The middle panel shows the distribution of models with fUV = 0.1, while the bottom panel shows models with fUV = 0.001. The arrows point to the location of sources with different values of β. The solid line is a linear fit to the observed data.
Current usage metrics show cumulative count of Article Views (full-text article views including HTML views, PDF and ePub downloads, according to the available data) and Abstracts Views on Vision4Press platform.
Data correspond to usage on the plateform after 2015. The current usage metrics is available 48-96 hours after online publication and is updated daily on week days.
Initial download of the metrics may take a while.