Free Access
Fig. 15
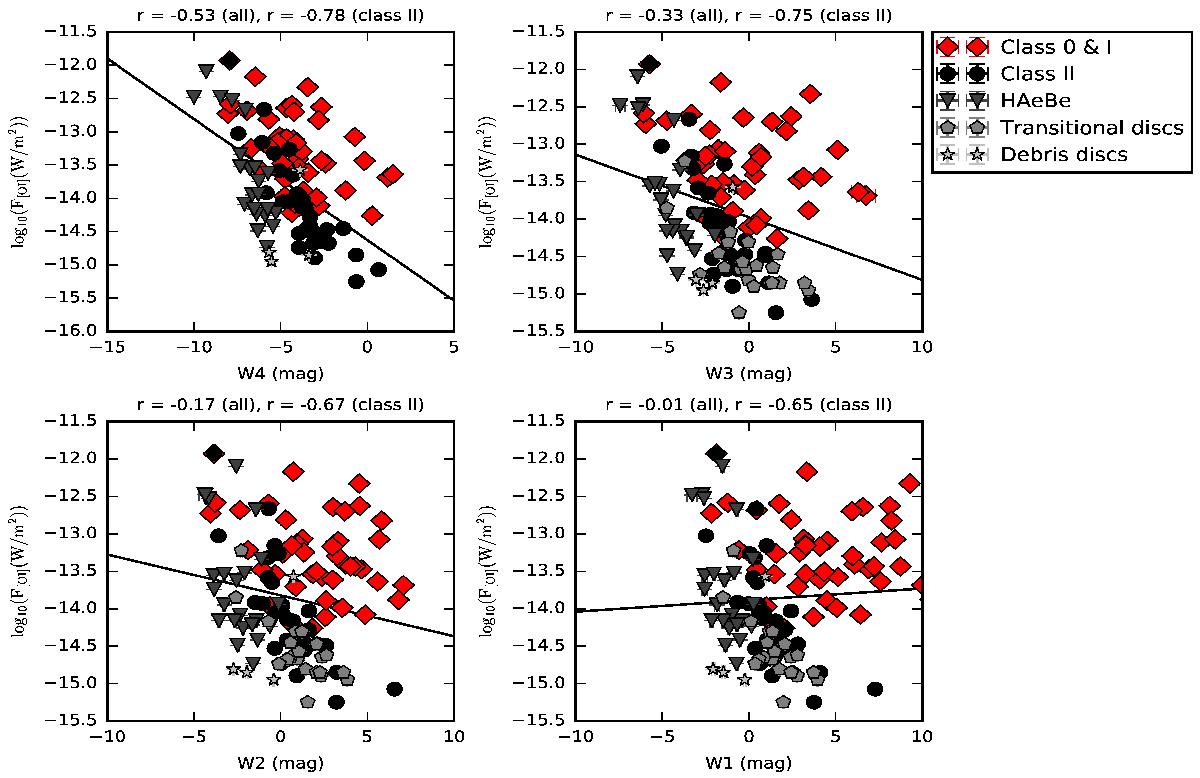
[OI] fluxes at 63 μm versus WISE magnitudes. All the fluxes have been scaled to the distance to Taurus. Magnitudes are corrected for distance. Spearman correlation coefficients are shown at the top of each plot.
Current usage metrics show cumulative count of Article Views (full-text article views including HTML views, PDF and ePub downloads, according to the available data) and Abstracts Views on Vision4Press platform.
Data correspond to usage on the plateform after 2015. The current usage metrics is available 48-96 hours after online publication and is updated daily on week days.
Initial download of the metrics may take a while.