Free Access
Fig. 14
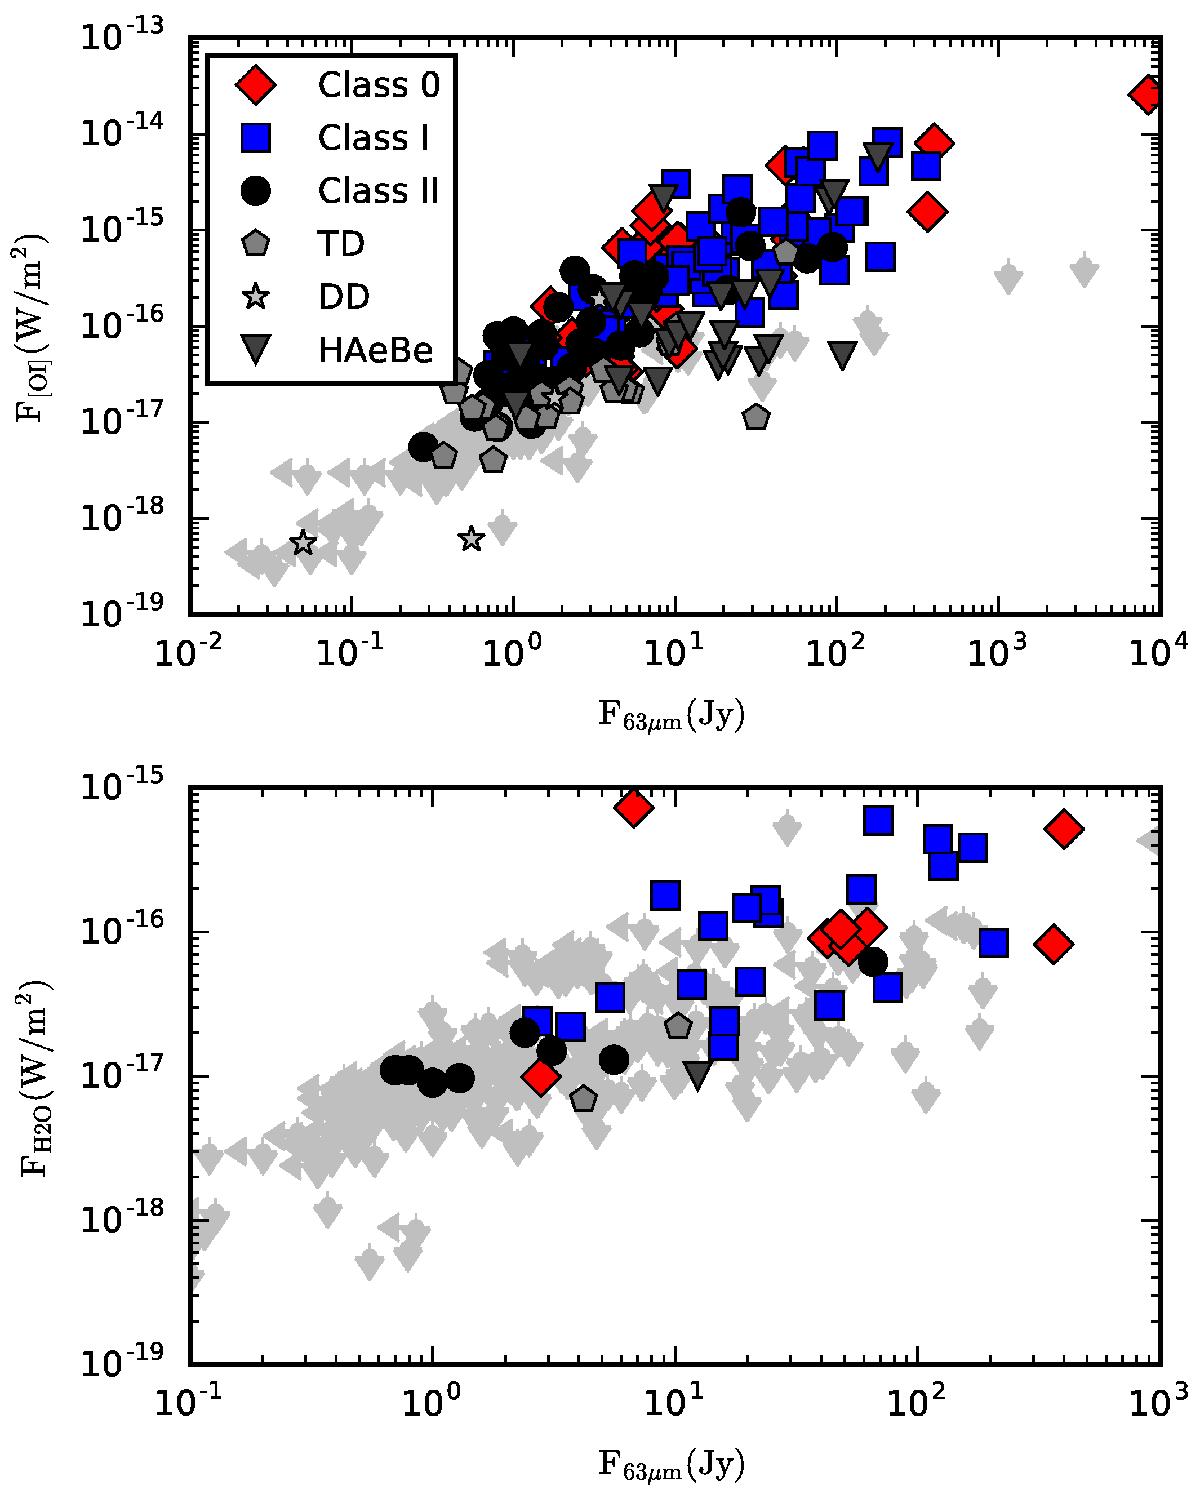
[OI] (top) and o-H2O (bottom) line fluxes versus continuum flux at 63 μm for sources in the sample. Sources are labelled according to evolutionary stage. All the fluxes have been scaled to the distance to Taurus (140 pc). Arrows show the position of upper limits for non-detected sources.
Current usage metrics show cumulative count of Article Views (full-text article views including HTML views, PDF and ePub downloads, according to the available data) and Abstracts Views on Vision4Press platform.
Data correspond to usage on the plateform after 2015. The current usage metrics is available 48-96 hours after online publication and is updated daily on week days.
Initial download of the metrics may take a while.