Free Access
Fig. 2
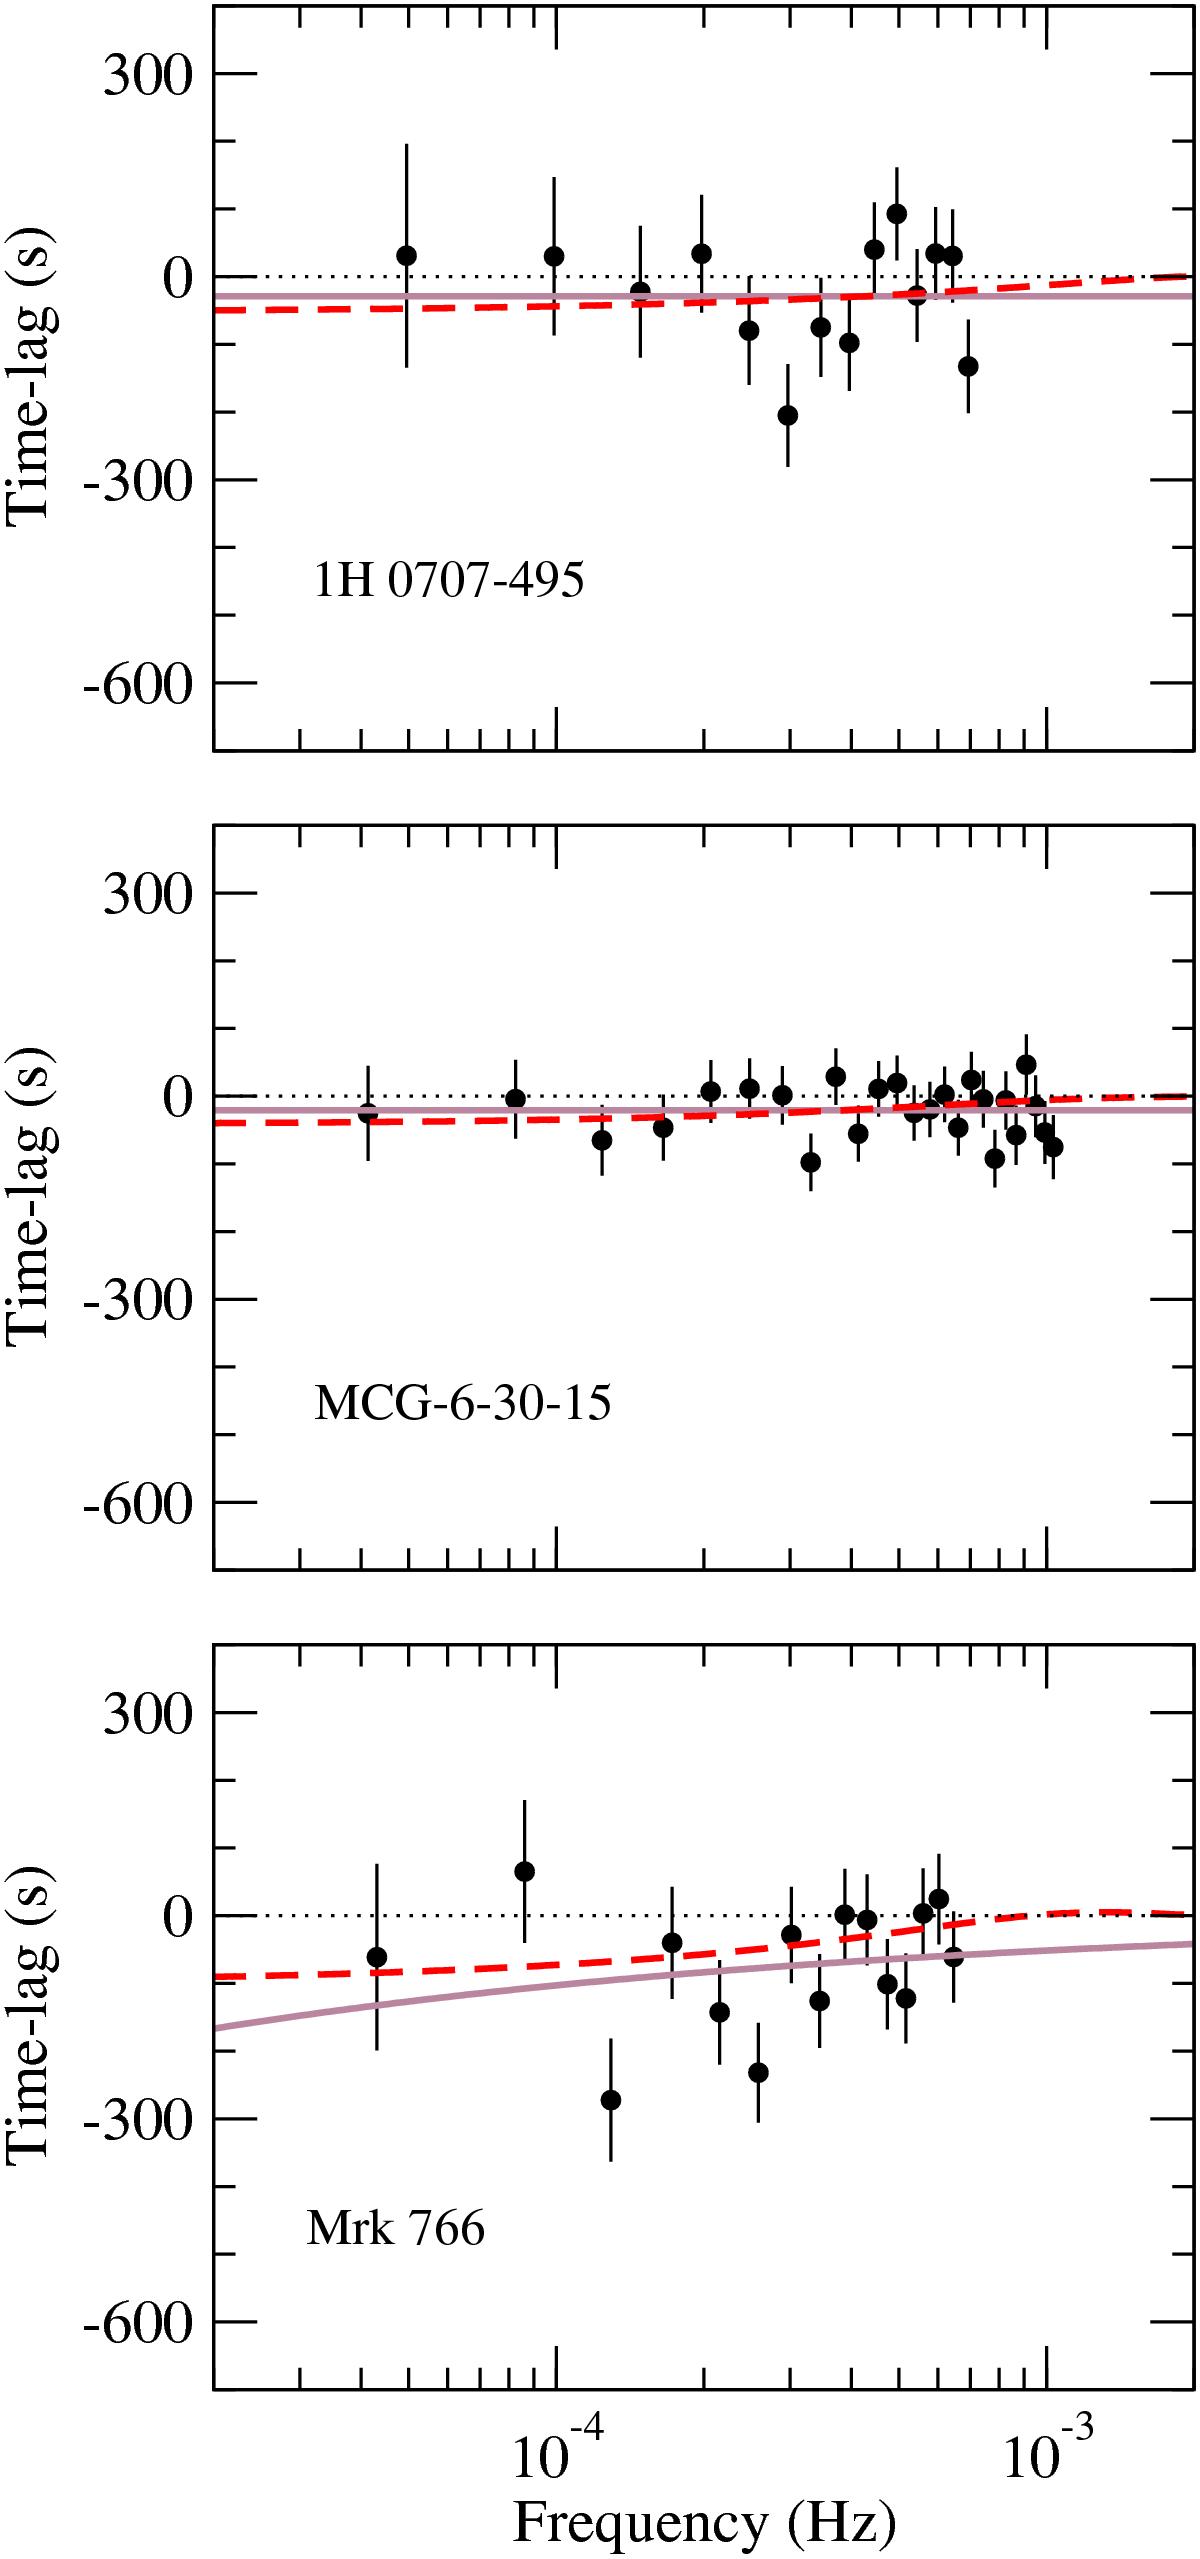
Observed iron line vs. continuum time-lag spectra for 1H 0707−495 (first row), MCG–6-30-15 (second row), and Mrk 766 (third row). The solid brown and dashed red lines indicate the best-fit models A and B, respectively, to each time-lag spectrum (see Sect. 5 for details on these models).
Current usage metrics show cumulative count of Article Views (full-text article views including HTML views, PDF and ePub downloads, according to the available data) and Abstracts Views on Vision4Press platform.
Data correspond to usage on the plateform after 2015. The current usage metrics is available 48-96 hours after online publication and is updated daily on week days.
Initial download of the metrics may take a while.