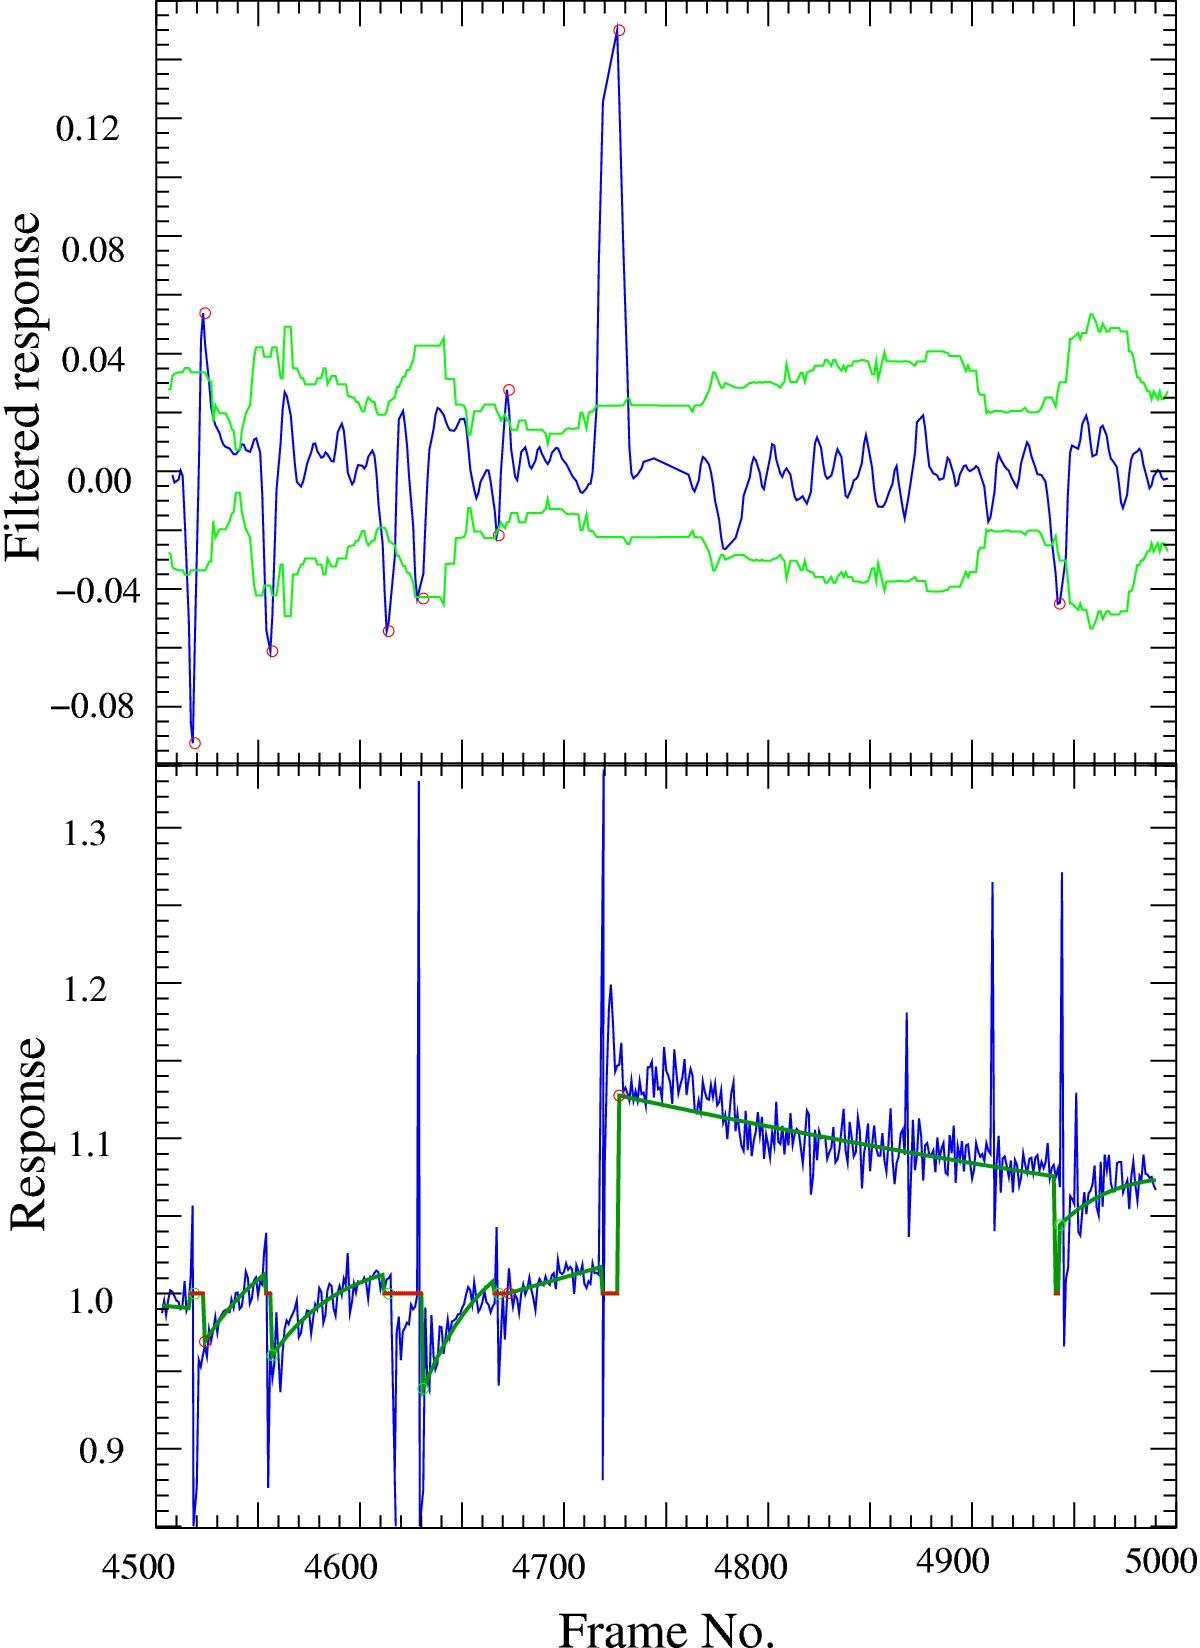
Fig. 8

Top panel: part of the response convolved with the first derivative of the Gaussian with dispersion equal to two frame units. This width gives the best sensitivity to sudden changes of the response caused by cosmic ray hits on the detectors. The green lines mark the region of ±5 times the local dispersion and the red circles marks the starting points of transients. Bottom panel: responsivity for the same block of frames with each interval between two consecutive discontinuities in the response fitted with our transient model (dark green). The red points mark the frame masked because the interval between two consecutive discontinuities is too short (less than 10 frames).
Current usage metrics show cumulative count of Article Views (full-text article views including HTML views, PDF and ePub downloads, according to the available data) and Abstracts Views on Vision4Press platform.
Data correspond to usage on the plateform after 2015. The current usage metrics is available 48-96 hours after online publication and is updated daily on week days.
Initial download of the metrics may take a while.


