Fig. 7
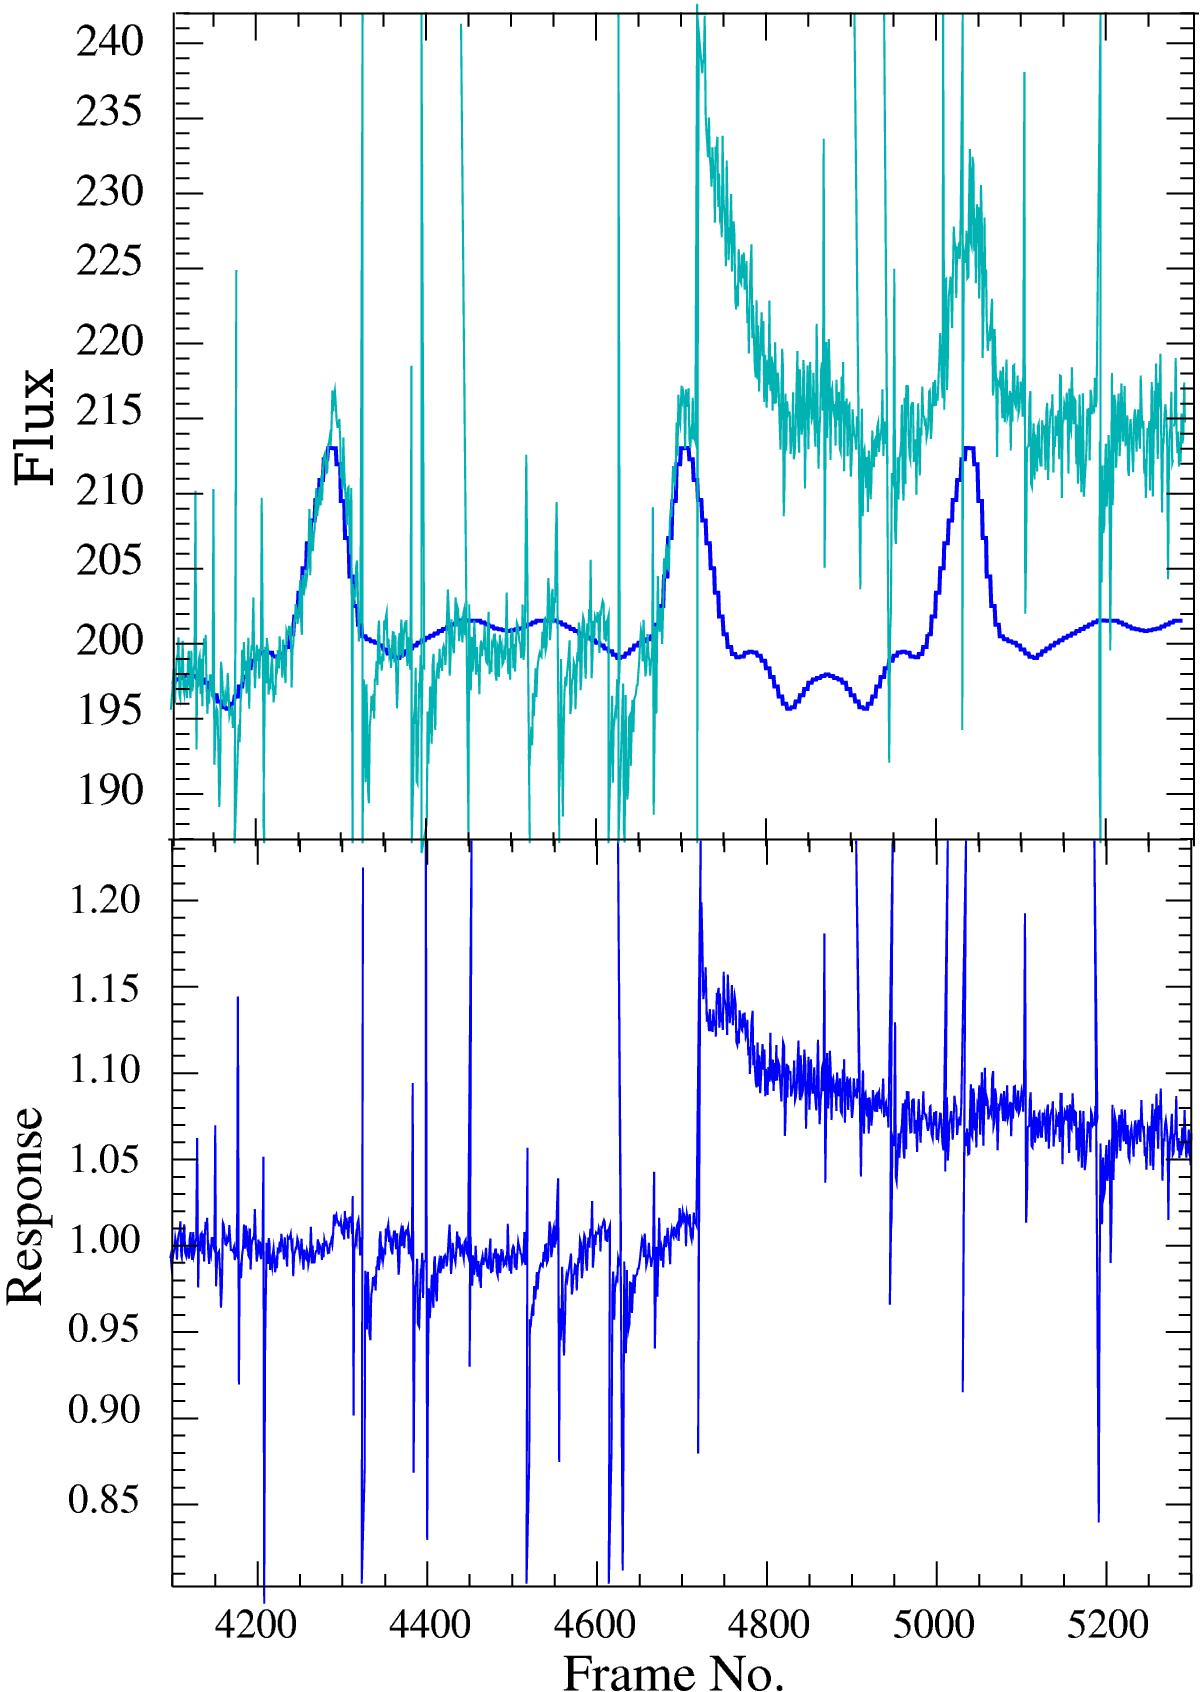
Top panel: a comparison of the observed signal of a single spectral pixel (cyan) with the Guess signal (blue; see text). The signal is plotted against the Frame Number, which is a function of time during the scan. We show three scans in the figure (two up and one down) which captures the C+ line shown in the previous figure. Just after the frame number 4720 a strong cosmic ray hits the detector producing a sudden change of the response of the detector. Bottom panel: the ratio of the two curves, i.e. the response of the pixel as a function of frame number. Many transients are clearly visible, in particular the huge transient after frame number 4720.
Current usage metrics show cumulative count of Article Views (full-text article views including HTML views, PDF and ePub downloads, according to the available data) and Abstracts Views on Vision4Press platform.
Data correspond to usage on the plateform after 2015. The current usage metrics is available 48-96 hours after online publication and is updated daily on week days.
Initial download of the metrics may take a while.