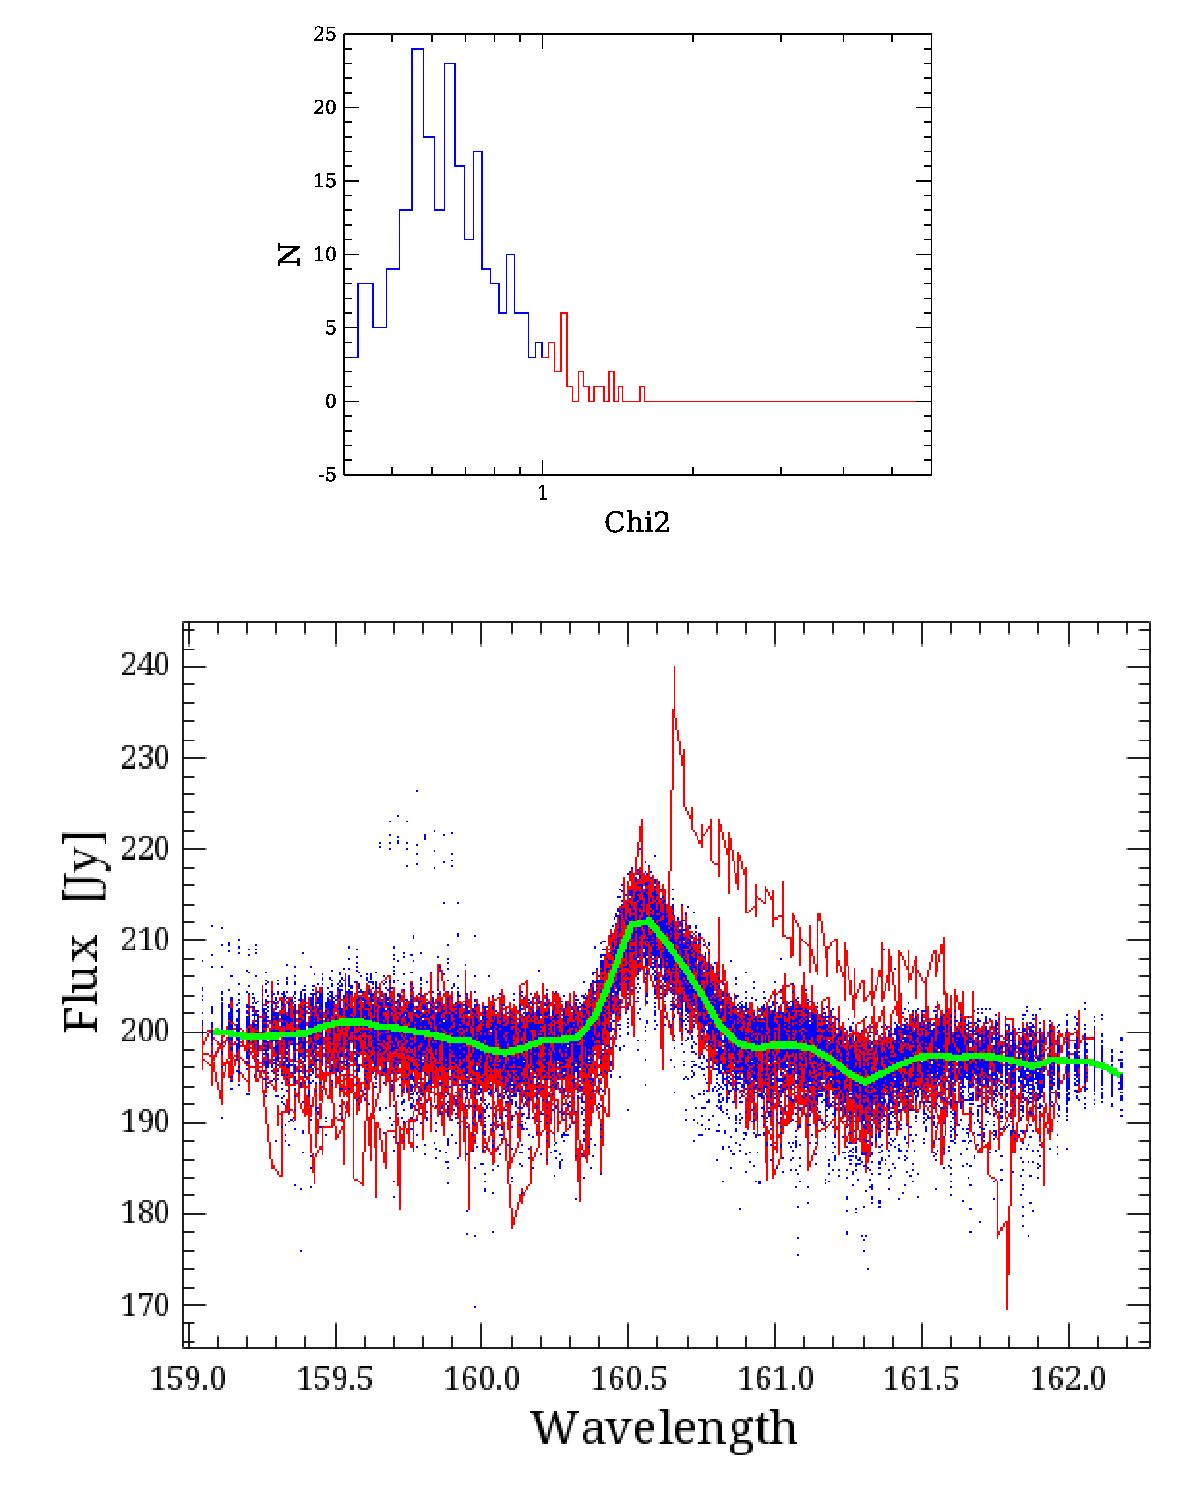
Fig. 6

An example of how we estimate the Guess spectrum for the C+ line of Arp 220 (obsID 1342202119). We compute the histogram of the normalized χ2 of each individual spectral scan with respect to the median spectrum (top panel). The blue line shows the well behaved scans and the red line shows those to be rejected. The Guess spectrum (bottom panel; green line) is the result of co-adding the well behaved scans (blue lines). The scans with χ2 deviating more than 3σ from the median value are discarded (red lines).
Current usage metrics show cumulative count of Article Views (full-text article views including HTML views, PDF and ePub downloads, according to the available data) and Abstracts Views on Vision4Press platform.
Data correspond to usage on the plateform after 2015. The current usage metrics is available 48-96 hours after online publication and is updated daily on week days.
Initial download of the metrics may take a while.


