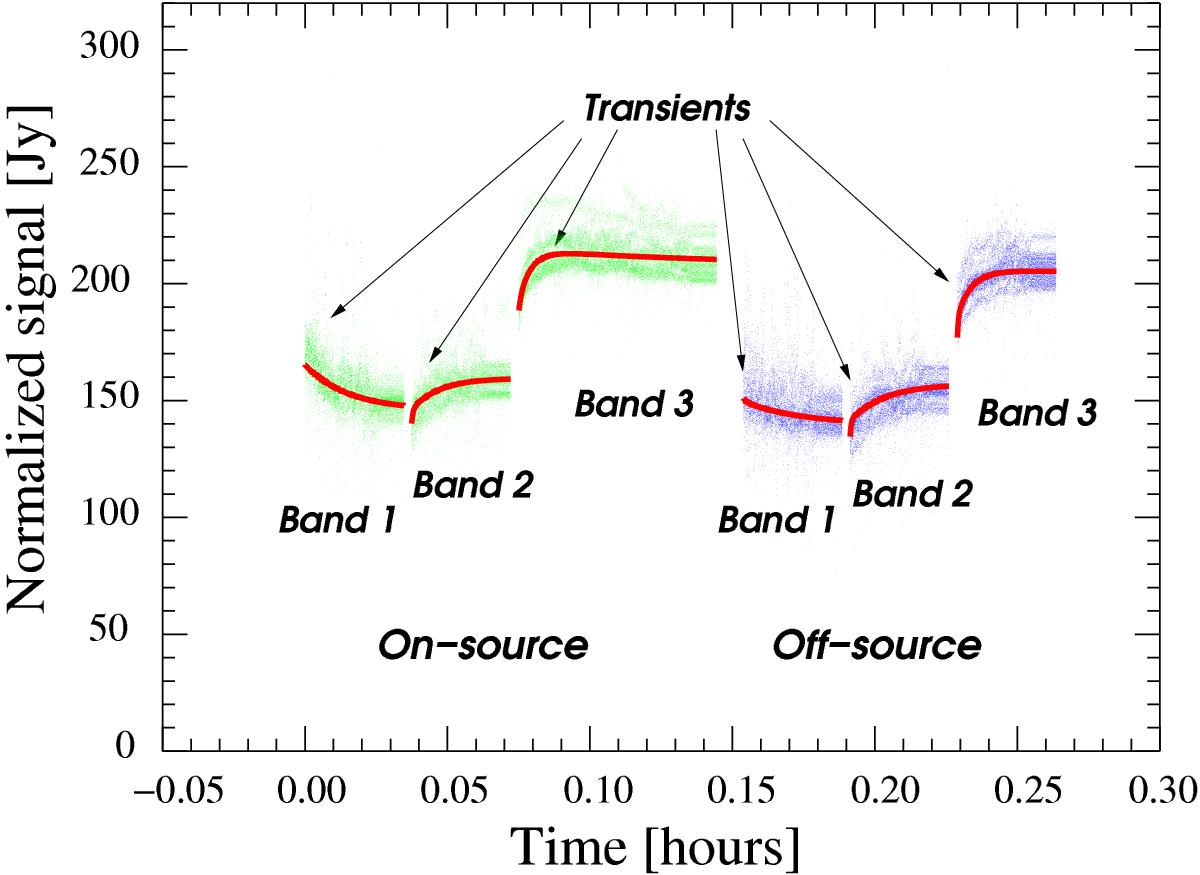
Fig. 5

The central spaxel of an observation of NGC 6543 (ObsID 1342215704) with three lines observed. For each observation block, the signal in each wavelength scan is divided by the last scan and normalized to its asymptotic median flux. The red line shows the transient model fitted. The first block comes after the calibration block (not shown) whose flux is higher than the continuum during this part of the observation. The three lines are observed first on the target (green dots) and then on the OFF position (blue dots). The gaps in these science data correspond to the time spent moving the grating, and slewing to the OFF position. Also in this case some pixels appear to behave differently because of the impact of cosmic rays.
Current usage metrics show cumulative count of Article Views (full-text article views including HTML views, PDF and ePub downloads, according to the available data) and Abstracts Views on Vision4Press platform.
Data correspond to usage on the plateform after 2015. The current usage metrics is available 48-96 hours after online publication and is updated daily on week days.
Initial download of the metrics may take a while.


