Free Access
Fig. 14
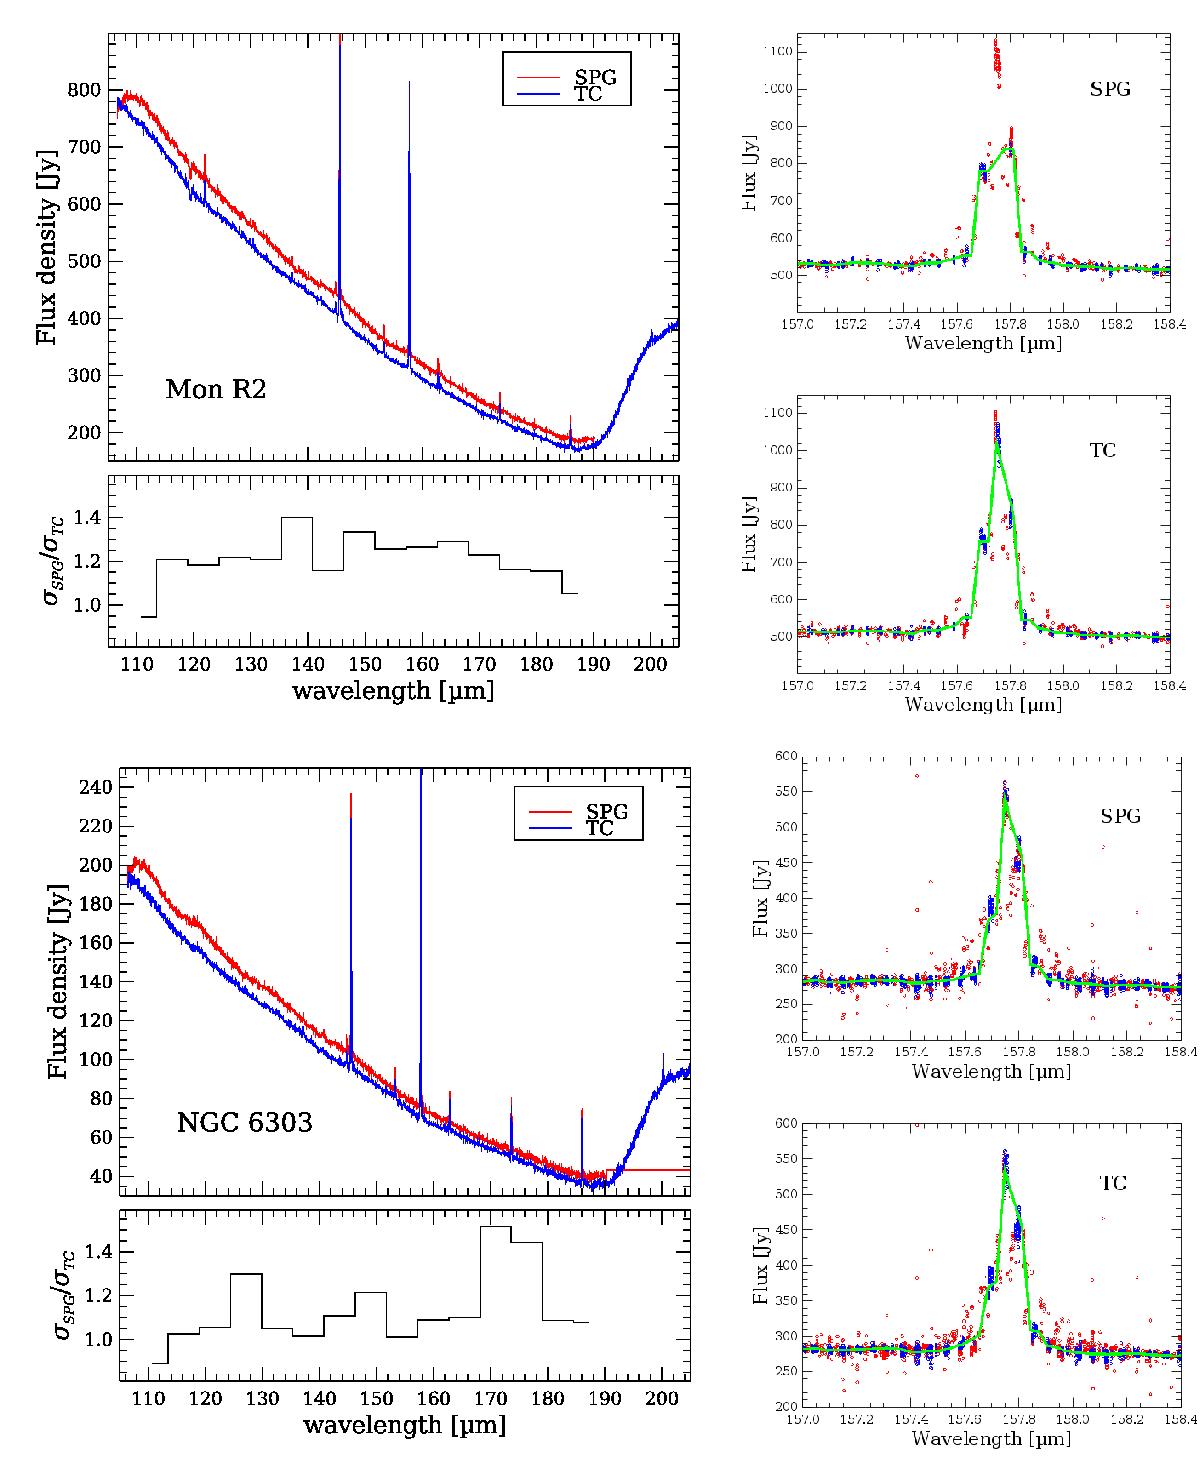
Left: spectra of Mon R2 and NGC 6303 from the archive products (SPG, red) and reduced with our pipeline (TC, blue). Right: [CII] line as recovered by the SPG and TC pipelines for the two sources before background subtraction. Masked frames are shown as red points.
Current usage metrics show cumulative count of Article Views (full-text article views including HTML views, PDF and ePub downloads, according to the available data) and Abstracts Views on Vision4Press platform.
Data correspond to usage on the plateform after 2015. The current usage metrics is available 48-96 hours after online publication and is updated daily on week days.
Initial download of the metrics may take a while.